Basisstatistiken
| Institutionelle Aktien (Long) | 401.664.100 - 90,49% (ex 13D/G) - change of 0,02MM shares 0,00% MRQ |
| Institutioneller Wert (Long) | $ 52.927.849 USD ($1000) |
Institutioneller Eigentümerschaft und Aktionäre
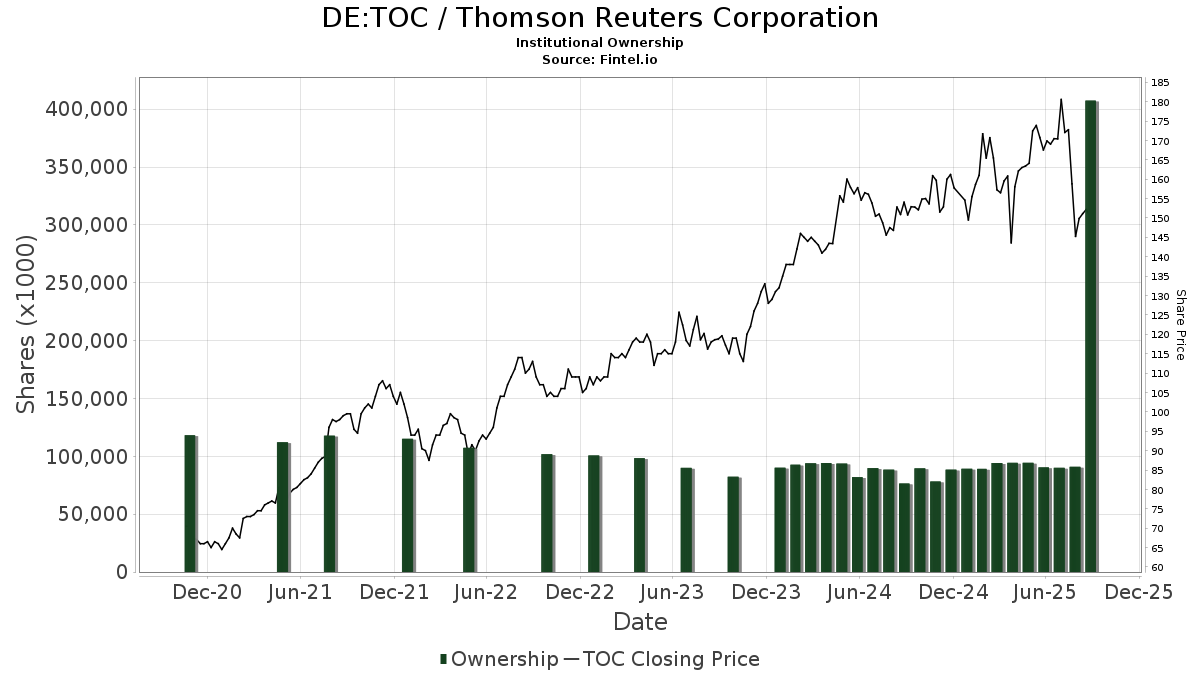
Thomson Reuters Corporation (DE:TOC) hat 500 institutionelle Eigentümer und Aktionäre, die 13D/G oder 13F Formulare bei der Securities Exchange Commission (SEC) eingereicht haben. Diese Institutionen halten insgesamt 401,664,100 Aktien. Die größten Aktionäre sind Woodbridge CO LTD, Royal Bank Of Canada, Bank Of Montreal /can/, Vanguard Group Inc, 1832 Asset Management L.P., Fmr Llc, Td Asset Management Inc, TLT Family Holdco ULC, LCC Family Corp., and SEG Family Corp. .
Thomson Reuters Corporation (DUSE:TOC) Die institutionelle Eigentümerstruktur zeigt die aktuellen Positionen von Institutionen und Fonds im Unternehmen sowie die jüngsten Veränderungen der Positionsgröße. Zu den Großaktionären können Einzelanleger, Investmentfonds, Hedgefonds oder Institutionen gehören. Der Schedule 13D zeigt an, dass der Investor mehr als 5% des Unternehmens hält (oder gehalten hat) und beabsichtigt (oder beabsichtigt hat), aktiv eine Änderung der Geschäftsstrategie zu verfolgen. Schedule 13G zeigt eine passive Investition von über 5% an.
The share price as of April 13, 2026 is 70,92 / share. Previously, on April 15, 2025, the share price was 154,80 / share. This represents a decline of 54,19% over that period.
Fondsstimmung-Score
Der Fondsstimmung-Score (auch bekannt als Eigentümer-Akkumulations-Score) ermittelt die Aktien, die am meisten von Fonds gekauft werden. Er ist das Ergebnis eines ausgeklügelten quantitativen Multifaktormodells, das die Unternehmen mit den höchsten institutionellen Käufen identifiziert. Das Scoring-Modell verwendet eine Kombination aus der Gesamtzunahme der offengelegten Eigentümer, den Änderungen der Portfolioallokationen in diesen Eigentümern und anderen Metriken. Die Zahl reicht von 0 bis 100, wobei höhere Zahlen ein höheres Maß an Kapitalakkumulation als bei anderen Unternehmen anzeigen und 50 den Durchschnitt darstellt.
Aktualisierungshäufigkeit: Täglich
Siehe Ownership Explorer, der eine Liste der am höchsten bewerteten Unternehmen enthält.
AI+ Ask Fintel’s AI assistant about Thomson Reuters Corporation.
Select a question to share a public post with an AI-crafted answer.
Thinking of good questions…
13F und NPORT Einreichungen
Details zu 13F-Einreichungen sind kostenlos. Für Details zu NP-Einreichungen ist eine Premium-Mitgliedschaft erforderlich. Grüne Zeilen zeigen neue Positionen an. Rote Zeilen zeigen geschlossene Positionen an. Klicken Sie auf das Link Symbol, um den gesamten Transaktionsverlauf zu sehen.
Upgrade
um Prämiendaten freizuschalten und nach Excel zu exportieren ![]() .
.
| Datei Datum | Quelle | Anleger | Typ | Durchschnittlicher Preis (Est) |
Aktien | Δ Aktien (%) |
Gemeldeter Wert ($1000) |
Δ Wert (%) |
Port Alloc (%) |
|
|---|---|---|---|---|---|---|---|---|---|---|
| 2026-02-05 | 13F | Cambridge Investment Research Advisors, Inc. | 13.828 | 33,71 | 2 | 0,00 | ||||
| 2026-02-17 | 13F | Jain Global LLC | 23.742 | -16,52 | 3.131 | -29,10 | ||||
| 2026-02-13 | 13F | 1832 Asset Management L.P. | 5.254.469 | 191,85 | 693.012 | 147,81 | ||||
| 2026-02-13 | 13F | Storgate, LLC | 2.543 | 335 | ||||||
| 2026-02-18 | 13F | Vident Advisory, LLC | 2.572 | -0,43 | 339 | -15,46 | ||||
| 2026-02-05 | 13F | Abacus Wealth Partners, LLC | 8.030 | 1.059 | ||||||
| 2026-02-13 | 13F | Mml Investors Services, Llc | 6.931 | -8,09 | 914 | -21,95 | ||||
| 2026-01-27 | 13F | Jackson, Grant Investment Advisers, Inc. | 3.664 | 0,00 | 484 | -14,94 | ||||
| 2026-02-17 | 13F | Ancora Advisors, LLC | 13 | 0,00 | 2 | -50,00 | ||||
| 2026-02-11 | 13F | O'shaughnessy Asset Management, Llc | 13.694 | -26,42 | 1.806 | -37,49 | ||||
| 2026-02-06 | 13F/A | Rathbone Brothers plc | 71.186 | -20,75 | 9.407 | -32,57 | ||||
| 2026-01-20 | 13F | Tritonpoint Wealth, Llc | 0 | -100,00 | 0 | |||||
| 2026-01-16 | 13F | Hopwood Financial Services, Inc. | 0 | -100,00 | 0 | |||||
| 2026-02-09 | 13F | Geode Capital Management, Llc | 2.224.706 | 3,58 | 297.536 | -11,68 | ||||
| 2026-02-13 | 13F | First Trust Advisors Lp | 1.191.606 | 10,85 | 157.161 | -5,88 | ||||
| 2026-02-11 | 13F | Franklin Resources Inc | 54.823 | -8,70 | 7.235 | -22,40 | ||||
| 2026-02-13 | 13F | Blueshift Asset Management, LLC | 11.934 | 7,24 | 1.574 | -8,97 | ||||
| 2025-11-14 | 13F | Truvestments Capital Llc | 0 | 0 | ||||||
| 2026-01-29 | 13F | Montrusco Bolton Investments Inc. | 29.041 | -22,90 | 3.837 | -34,41 | ||||
| 2026-02-10 | 13F | Sivia Capital Partners, LLC | 1.660 | -2,81 | 219 | -17,74 | ||||
| 2025-11-14 | 13F | Hrt Financial Lp | 0 | -100,00 | 0 | -100,00 | ||||
| 2026-01-05 | 13F | Roxbury Financial LLC | 62 | -46,09 | 8 | -52,94 | ||||
| 2026-02-13 | 13F | Arrowstreet Capital, Limited Partnership | 9.014 | 130,83 | 1.189 | 96,04 | ||||
| 2026-02-13 | 13F | First National Bank Of Omaha | 3.158 | 419 | ||||||
| 2026-01-15 | 13F | Nisa Investment Advisors, Llc | 306 | -49,75 | 40 | -57,45 | ||||
| 2026-02-02 | 13F | Montag A & Associates Inc | 325 | 43 | ||||||
| 2026-02-13 | 13F | Alberta Investment Management Corp | 16.000 | 2.112 | ||||||
| 2025-11-10 | 13F | Marshall & Sterling Wealth Advisors Inc. | 0 | -100,00 | 0 | -100,00 | ||||
| 2026-01-05 | 13F | Argent Capital Management Llc | 0 | -100,00 | 0 | |||||
| 2026-01-20 | 13F | Stratos Wealth Partners, LTD. | 14.060 | 6,68 | 1.854 | -9,43 | ||||
| 2026-02-11 | 13F | Capital Analysts, Inc. | 66 | -14,29 | 0 | |||||
| 2026-01-08 | 13F | Sound View Wealth Advisors Group, LLC | 0 | -100,00 | 0 | |||||
| 2026-01-26 | 13F | PDS Planning, Inc | 1.909 | -21,83 | 252 | -33,77 | ||||
| 2026-02-03 | 13F/A | Mount Yale Investment Advisors, LLC | 0 | -100,00 | 0 | -100,00 | ||||
| 2026-02-17 | 13F | United Capital Financial Advisers, Llc | 62.915 | -3,51 | 8.298 | -18,08 | ||||
| 2026-02-17 | 13F | Bank Of America Corp /de/ | 1.094.266 | -10,26 | 144.323 | -23,80 | ||||
| 2025-11-17 | 13F | IMS Capital Management | 2.868 | -8,75 | 445 | -29,59 | ||||
| 2026-01-22 | 13F | Maseco Llp | 46 | 6 | ||||||
| 2026-02-06 | 13F | Callahan Advisors, LLC | 26.314 | 0,00 | 3.471 | -15,10 | ||||
| 2026-02-17 | 13F | Coastal Bridge Advisors, LLC | 6.184 | 7,75 | 816 | -8,53 | ||||
| 2026-02-17 | 13F | Aqr Capital Management Llc | 72.605 | 194,07 | 9.579 | 149,78 | ||||
| 2026-02-17 | 13F | Tower Research Capital LLC (TRC) | 20.684 | 35,55 | 2.728 | 15,11 | ||||
| 2025-11-14 | 13F | Peak6 Llc | Call | 0 | -100,00 | 0 | ||||
| 2026-01-20 | 13F | Princeton Global Asset Management LLC | 60 | 0,00 | 8 | -22,22 | ||||
| 2025-10-30 | 13F | Twin Peaks Wealth Advisors, LLC | 0 | -100,00 | 0 | -100,00 | ||||
| 2026-02-13 | 13F | Headlands Technologies LLC | 15.963 | 2,91 | 2.105 | -12,62 | ||||
| 2025-11-14 | 13F | Icon Wealth Advisors, LLC | 0 | -100,00 | 0 | -100,00 | ||||
| 2026-02-10 | 13F | Savant Capital, LLC | 3.708 | -7,25 | 489 | -21,26 | ||||
| 2025-11-05 | 13F | Wellington Shields Capital Management, LLC | 0 | -100,00 | 0 | -100,00 | ||||
| 2026-01-29 | 13F | Vanguard Group Inc | 5.776.640 | 1,51 | 762.320 | -13,73 | ||||
| 2026-01-30 | 13F | Mitsubishi UFJ Trust & Banking Corp | 33.400 | 4.355 | ||||||
| 2025-10-31 | 13F | Whittier Trust Co | 0 | -100,00 | 0 | -100,00 | ||||
| 2026-02-13 | 13F | Cornerstone Financial Management LLC | 17 | 2 | ||||||
| 2026-02-17 | 13F | Credit Agricole S A | 33.572 | 22,85 | 4.428 | 4,31 | ||||
| 2025-11-14 | 13F | Point72 (DIFC) Ltd | 14.069 | 2.185 | ||||||
| 2026-02-11 | 13F | Simplex Trading, Llc | 295 | 39 | ||||||
| 2026-01-29 | 13F | UBS Group AG | 440.146 | 40,06 | 58.051 | 18,93 | ||||
| 2026-02-02 | 13F | PKO Investment Management Joint-Stock Co | 13.000 | 1.719 | ||||||
| 2026-02-09 | 13F | Key FInancial Inc | 2.753 | 0,00 | 364 | -13,57 | ||||
| 2025-11-14 | 13F | ICONIQ Capital, LLC | 0 | -100,00 | 0 | -100,00 | ||||
| 2026-02-17 | 13F | Wellington Management Group Llp | 0 | -100,00 | 0 | |||||
| 2026-02-17 | 13F | Utah Retirement Systems | 15.381 | 0,00 | 2.032 | -14,91 | ||||
| 2026-02-11 | 13F | Syon Capital Llc | 4.963 | 655 | ||||||
| 2026-02-23 | 13F | Mv Capital Management, Inc. | 1 | 0 | ||||||
| 2026-02-13 | 13F | Ossiam | 0 | -100,00 | 0 | |||||
| 2026-04-08 | 13F | Wealth Enhancement Trust Services, Inc. | 2.039 | 183 | ||||||
| 2026-02-17 | 13F | First Manhattan Co | 0 | -100,00 | 0 | |||||
| 2026-02-13 | 13F | Korea Investment CORP | 82.744 | -0,24 | 10.934 | -15,13 | ||||
| 2026-02-17 | 13F | FIL Ltd | 89.676 | -84,37 | 11.834 | -86,72 | ||||
| 2026-02-17 | 13F | Quadrature Capital Ltd | 372.700 | 2.105,33 | 49.248 | 1.777,54 | ||||
| 2026-02-12 | 13F | Promethium Advisors,llc | 10.888 | -26,87 | 1.436 | -37,89 | ||||
| 2026-01-23 | 13F | Assetmark, Inc | 2.315 | -97,01 | 305 | -97,46 | ||||
| 2026-01-12 | 13F | Daymark Wealth Partners, Llc | 0 | -100,00 | 0 | |||||
| 2026-02-13 | 13F | Marshall Wace, Llp | 0 | -100,00 | 0 | |||||
| 2025-11-14 | 13F | AXA Investment Managers S.A. | 153.538 | 23.849 | ||||||
| 2026-02-02 | 13F | Triasima Portfolio Management inc. | 9.411 | -68,36 | 1.244 | -73,10 | ||||
| 2026-02-10 | 13F | Intech Investment Management Llc | 8.002 | -88,56 | 1.057 | -90,27 | ||||
| 2026-02-13 | 13F | Royal London Asset Management Ltd | 8.037 | 1,70 | 1.060 | -13,61 | ||||
| 2026-01-14 | 13F | Bond & Devick Financial Network, Inc. | 0 | -100,00 | 0 | -100,00 | ||||
| 2026-02-03 | 13F | Maxi Investments CY Ltd | 0 | -100,00 | 0 | |||||
| 2026-02-12 | 13F | Sit Investment Associates Inc | 0 | -100,00 | 0 | |||||
| 2026-01-23 | 13F | Brown, Lisle/cummings, Inc. | 3 | 0,00 | 0 | |||||
| 2026-01-16 | 13F | Crewe Advisors LLC | 524 | -17,09 | 69 | -29,59 | ||||
| 2026-04-13 | 13F | IFP Advisors, Inc | 15 | -82,56 | 1 | -90,91 | ||||
| 2026-02-12 | 13F | Cibc World Markets Corp | 21.609 | 2.850 | ||||||
| 2026-02-12 | 13F | Commonwealth Equity Services, Llc | 7.431 | -14,32 | 980 | 97.900,00 | ||||
| 2026-02-13 | 13F | Kestra Advisory Services, LLC | 0 | -100,00 | 0 | |||||
| 2025-11-14 | 13F | Walleye Capital LLC | Put | 0 | -100,00 | 0 | -100,00 | |||
| 2026-02-10 | 13F | Jupiter Asset Management Ltd | 0 | -100,00 | 0 | |||||
| 2025-11-10 | 13F | Resources Investment Advisors, LLC. | 0 | -100,00 | 0 | -100,00 | ||||
| 2026-02-10 | 13F | Catalyst Capital Advisors LLC | 113 | -49,33 | 15 | -58,82 | ||||
| 2026-02-11 | 13F | Clearbridge Investments, LLC | 234.156 | 30.883 | ||||||
| 2025-11-07 | 13F | Wealthcare Advisory Partners LLC | 0 | -100,00 | 0 | -100,00 | ||||
| 2026-02-06 | 13F | Harvest Portfolios Group Inc. | 3.365 | 18,44 | 444 | 0,68 | ||||
| 2026-01-29 | 13F | Sanctuary Advisors, LLC | 3.875 | -2,98 | 512 | -17,42 | ||||
| 2026-02-17 | 13F | Mercer Global Advisors Inc /adv | 3.349 | 2,95 | 442 | -12,67 | ||||
| 2026-02-10 | 13F | BKD Wealth Advisors, LLC | 2.233 | 6,89 | 295 | -9,26 | ||||
| 2026-02-17 | 13F | Snowden Capital Advisors LLC | 0 | -100,00 | 0 | |||||
| 2025-11-17 | 13F | Kestra Investment Management, LLC | 0 | -100,00 | 0 | |||||
| 2026-02-10 | 13F | Goldman Sachs Group Inc | 2.319.776 | -3,76 | 305.955 | -18,28 | ||||
| 2026-02-11 | 13F | Vise Technologies, Inc. | 6.501 | -21,71 | 857 | -33,51 | ||||
| 2026-02-17 | 13F | State Of Wisconsin Investment Board | 55.036 | 7.272 | ||||||
| 2026-02-13 | 13F | Manufacturers Life Insurance Company, The | 0 | -100,00 | 0 | |||||
| 2026-02-05 | 13F | Stephens Inc /ar/ | 0 | -100,00 | 0 | -100,00 | ||||
| 2026-02-06 | 13F | EverSource Wealth Advisors, LLC | 1.042 | -13,74 | 137 | -26,74 | ||||
| 2026-02-17 | 13F | Private Advisor Group, LLC | 1.901 | -53,14 | 251 | -60,32 | ||||
| 2026-02-10 | 13F | Bank of New York Mellon Corp | 493.071 | 10,46 | 65.031 | -6,21 | ||||
| 2026-02-02 | 13F | Oppenheimer Asset Management Inc. | 1.859 | 7,89 | 245 | -8,24 | ||||
| 2026-01-28 | 13F | CAPROCK Group, Inc. | 4.742 | 53,96 | 625 | 13,84 | ||||
| 2026-04-06 | 13F | Versant Capital Management, Inc | 2.114 | 41,88 | 190 | -3,06 | ||||
| 2026-01-22 | 13F | Addenda Capital Inc. | 48.500 | -9,84 | 8.785 | -24,43 | ||||
| 2026-02-02 | 13F | Principal Financial Group Inc | 21.196 | 1,19 | 2.801 | -13,93 | ||||
| 2026-02-12 | 13F | Voya Investment Management Llc | 18.693 | -2,50 | 2.470 | -17,03 | ||||
| 2026-01-29 | 13F | D.a. Davidson & Co. | 2.739 | 0,00 | 361 | -15,06 | ||||
| 2025-11-13 | 13F | Seacrest Wealth Management, Llc | 0 | -100,00 | 0 | -100,00 | ||||
| 2026-02-13 | 13F | Umb Bank N A/mo | 119 | -73,02 | 16 | -77,94 | ||||
| 2026-02-13 | 13F | Evelyn Partners Investment Management LLP | 6.177 | -4,35 | 815 | -18,66 | ||||
| 2025-10-22 | 13F | Kathmere Capital Management, LLC | 0 | -100,00 | 0 | -100,00 | ||||
| 2026-01-20 | 13F | Cromwell Holdings LLC | 508 | 0,00 | 67 | -14,10 | ||||
| 2026-01-16 | 13F | Ronald Blue Trust, Inc. | 288 | -21,10 | 38 | -33,93 | ||||
| 2026-02-17 | 13F | Trexquant Investment LP | 23.018 | -76,67 | 3.036 | -80,20 | ||||
| 2025-11-12 | 13F | Buckingham Strategic Partners | 0 | -100,00 | 0 | |||||
| 2026-02-11 | 13F | Zions Bancorporation, National Association /ut/ | 84 | 0,00 | 11 | -15,38 | ||||
| 2026-02-17 | 13F | Amundi | 429.944 | 43,22 | 56.705 | 24,25 | ||||
| 2025-11-14 | 13F | Wexford Capital Lp | 0 | -100,00 | 0 | -100,00 | ||||
| 2026-01-29 | 13F | Kestra Private Wealth Services, Llc | 8.433 | -21,98 | 1.112 | -33,73 | ||||
| 2026-02-13 | 13F | Aviso Financial Inc. | 0 | -100,00 | 0 | |||||
| 2026-02-17 | 13F | Prana Capital Management, LP | 7.787 | 1.027 | ||||||
| 2025-11-14 | 13F | DRW Securities, LLC | 0 | -100,00 | 0 | |||||
| 2026-01-15 | 13F | Fortitude Family Office, LLC | 31 | -24,39 | 4 | -33,33 | ||||
| 2026-02-11 | 13F | Palladiem, Llc | 155 | 21 | ||||||
| 2026-01-21 | 13F | Impact Investors, Inc | 3.658 | -19,12 | 482 | -31,34 | ||||
| 2026-02-17 | 13F | Captrust Financial Advisors | 2.513 | -2,37 | 332 | -17,04 | ||||
| 2026-02-17 | 13F | Occudo Quantitative Strategies Lp | 49.936 | 6.586 | ||||||
| 2026-02-11 | 13F | Manchester Capital Management LLC | 921 | 121 | ||||||
| 2026-02-17 | 13F | Prosperity Consulting Group, LLC | 4.806 | -0,15 | 634 | -15,26 | ||||
| 2026-02-17 | 13F | GeoWealth Management, LLC | 0 | -100,00 | 0 | |||||
| 2026-03-02 | 13F | Tobam | 748 | -6,73 | 0 | |||||
| 2026-02-13 | 13F | JustInvest LLC | 9.932 | -21,53 | 1.310 | -33,86 | ||||
| 2026-02-17 | 13F | Guggenheim Capital Llc | 103.099 | 0,91 | 13.598 | -14,32 | ||||
| 2026-01-09 | 13F | 180 Wealth Advisors, Llc | 0 | -100,00 | 0 | |||||
| 2026-02-03 | 13F | Ethic Inc. | 3.066 | 21,76 | 404 | 3,32 | ||||
| 2026-02-11 | 13F | Jpmorgan Chase & Co | 761.992 | -39,73 | 100.499 | -48,82 | ||||
| 2026-02-11 | 13F | 111 Capital | 8.322 | 1.098 | ||||||
| 2026-02-10 | 13F | Murphy & Mullick Capital Management Corp | 48 | 0,00 | 6 | -14,29 | ||||
| 2025-11-14 | 13F | Capstone Investment Advisors, Llc | 6.234 | 968 | ||||||
| 2026-01-20 | 13F | Sara-Bay Financial | 3.176 | 0,00 | 422 | -14,60 | ||||
| 2026-02-13 | 13F | SRS Capital Advisors, Inc. | 890 | -19,60 | 118 | -31,98 | ||||
| 2026-02-13 | 13F | Macquarie Group Ltd | 4.456 | 588 | ||||||
| 2026-02-10 | 13F | Bnp Paribas Arbitrage, Sa | 483.198 | 26,46 | 63.729 | 7,38 | ||||
| 2026-02-11 | 13F | Parallel Advisors, LLC | 2.873 | 3,16 | 379 | -12,27 | ||||
| 2026-02-12 | 13F | BlackRock, Inc. | 1.350.839 | -28,32 | 178.162 | -39,14 | ||||
| 2026-02-06 | 13F | First Business Financial Services, Inc. | 3.942 | 0,00 | 520 | -15,20 | ||||
| 2025-11-07 | 13F | Advisors Capital Management, LLC | 0 | -100,00 | 0 | -100,00 | ||||
| 2026-02-06 | 13F | KDT Advisors, LLC | 2.503 | 8,92 | 330 | -7,30 | ||||
| 2026-02-12 | 13F | Ensign Peak Advisors, Inc | 8.176 | 5,14 | 1.080 | -10,52 | ||||
| 2025-10-24 | 13F | ORG Partners LLC | 0 | -100,00 | 0 | -100,00 | ||||
| 2026-04-13 | 13F | True Wealth Design, LLC | 186 | 353,66 | 17 | 220,00 | ||||
| 2026-02-13 | 13F | Timelo Investment Management Inc. | 12.000 | 1.583 | ||||||
| 2026-01-12 | 13F | Legacy Wealth Asset Management, LLC | 0 | -100,00 | 0 | -100,00 | ||||
| 2026-02-17 | 13F | Janus Henderson Group Plc | 13.676 | -9,29 | 1.822 | -22,40 | ||||
| 2026-01-30 | 13F | Bogart Wealth, LLC | 19 | 0,00 | 3 | 0,00 | ||||
| 2026-02-17 | 13F | Two Sigma Advisers, Lp | 178.846 | 110,32 | 23.588 | 78,58 | ||||
| 2026-02-12 | 13F | Scotia Capital Inc. | 367.317 | 27,25 | 48.379 | 8,35 | ||||
| 2026-01-23 | 13F | Bridgewater Advisors Inc. | 2.511 | 0,36 | 302 | -13,26 | ||||
| 2026-01-20 | 13F | Cigna Investments Inc /new | 2.864 | 0,00 | 0 | |||||
| 2026-01-23 | 13F | Halbert Hargrove Global Advisors, Llc | 0 | -100,00 | 0 | |||||
| 2026-02-13 | 13F | MAI Capital Management | 627 | 2.311,54 | 83 | 1.950,00 | ||||
| 2026-02-10 | 13F | Moors & Cabot, Inc. | 2.474 | 0,00 | 326 | -15,10 | ||||
| 2026-01-23 | 13F | Sumitomo Mitsui Trust Holdings, Inc. | 77.601 | 19,15 | 10.235 | 1,17 | ||||
| 2026-02-17 | 13F | Boreal Capital Management LLC | 102 | 0,00 | 13 | -13,33 | ||||
| 2026-02-17 | 13F | Quantessence Capital LLC | 0 | -100,00 | 0 | |||||
| 2026-02-12 | 13F | Penserra Capital Management LLC | 27 | 0,00 | 0 | |||||
| 2026-02-12 | 13F | ICICI Prudential Asset Management Co Ltd | 7.139 | 3,15 | 942 | -12,47 | ||||
| 2026-02-13 | 13F | Citigroup Inc | 224.436 | -34,71 | 29.657 | -44,45 | ||||
| 2026-02-18 | 13F | State of Tennessee, Treasury Department | 73.032 | -2,74 | 8.114 | -30,42 | ||||
| 2025-10-24 | 13F | Hemington Wealth Management | 19 | 0,00 | 0 | |||||
| 2026-02-13 | 13F | Aigen Investment Management, Lp | 0 | -100,00 | 0 | |||||
| 2026-02-17 | 13F | Citadel Advisors Llc | Call | 39.900 | 353,41 | 5.262 | 285,21 | |||
| 2026-01-21 | 13F | Clayton Financial Group LLC | 0 | -100,00 | 0 | |||||
| 2026-02-17 | 13F | Citadel Advisors Llc | 94.592 | -78,12 | 12.476 | -81,42 | ||||
| 2026-02-17 | 13F | Citadel Advisors Llc | Put | 19.800 | 12,50 | 2.611 | -4,46 | |||
| 2025-10-28 | 13F | Qrg Capital Management, Inc. | 0 | -100,00 | 0 | -100,00 | ||||
| 2026-04-08 | 13F | Dynamic Advisor Solutions LLC | 6.553 | -82,36 | 590 | -87,98 | ||||
| 2026-01-26 | 13F | PFG Investments, LLC | 1.532 | -23,97 | 202 | -35,46 | ||||
| 2026-02-05 | 13F | Qsemble Capital Management, LP | 8.462 | -76,40 | 1.116 | -79,96 | ||||
| 2026-02-17 | 13F | Point72 Asset Management, L.P. | Call | 3.700 | -96,30 | 488 | -96,86 | |||
| 2026-01-12 | 13F | CVA Family Office, LLC | 0 | -100,00 | 0 | |||||
| 2026-02-17 | 13F | Rakuten Investment Management, Inc. | 24.011 | 289,60 | 3.199 | 544,76 | ||||
| 2026-01-22 | 13F | City Holding Co | 90 | 0,00 | 12 | -15,38 | ||||
| 2026-02-12 | 13F | Northwest & Ethical Investments L.P. | 37.728 | 4,96 | 4.983 | -10,95 | ||||
| 2026-02-17 | 13F | Point72 Asset Management, L.P. | Put | 5.100 | 673 | |||||
| 2026-02-17 | 13F | SageView Advisory Group, LLC | 21 | 3 | ||||||
| 2025-11-06 | 13F | Blume Capital Management, Inc. | 0 | -100,00 | 0 | |||||
| 2025-11-13 | 13F | Riggs Asset Managment Co. Inc. | 0 | -100,00 | 0 | -100,00 | ||||
| 2026-02-11 | 13F | Twin Tree Management, LP | 5.787 | 763 | ||||||
| 2026-02-12 | 13F | Hilton Capital Management, LLC | 5.204 | -88,67 | 686 | -90,38 | ||||
| 2025-11-07 | 13F | Sierra Ocean, Llc | 0 | -100,00 | 0 | -100,00 | ||||
| 2026-02-13 | 13F | Transamerica Financial Advisors, Inc. | 155 | 20 | ||||||
| 2025-11-12 | 13F | Davis R M Inc | 0 | -100,00 | 0 | |||||
| 2025-11-13 | 13F | UBS Group AG | Call | 0 | -100,00 | 0 | -100,00 | |||
| 2026-02-13 | 13F | TLT Family Holdco ULC | 4.302.901 | 0,00 | 567.510 | -15,09 | ||||
| 2026-01-20 | 13F | Hanson & Doremus Investment Management | 823 | 0,00 | 0 | |||||
| 2026-01-27 | 13F | WealthCollab, LLC | 10 | 0,00 | 1 | 0,00 | ||||
| 2026-01-16 | 13F | Trust Co Of Vermont | 184 | 0,00 | 24 | -14,29 | ||||
| 2026-02-13 | 13F | Colony Group, LLC | 5.121 | 46,31 | 676 | 24,31 | ||||
| 2026-02-17 | 13F | Boothbay Fund Management, Llc | 1.834 | 242 | ||||||
| 2026-01-28 | 13F | DekaBank Deutsche Girozentrale | 29.582 | 0,00 | 5 | 0,00 | ||||
| 2026-02-11 | 13F | Outlook Wealth Advisors, LLC | 0 | -100,00 | 0 | -100,00 | ||||
| 2026-02-11 | 13F | Hilton Head Capital Partners, LLC | 10 | 1 | ||||||
| 2026-02-11 | 13F | Havemeyer Place LP | 5.796 | 764 | ||||||
| 2026-02-10 | 13F | Eurizon Capital SGR S.p.A. | 1.481 | 195 | ||||||
| 2025-10-24 | 13F | We Are One Seven, LLC | 0 | -100,00 | 0 | -100,00 | ||||
| 2026-02-06 | 13F | Global Retirement Partners, LLC | 50 | 11,11 | 7 | -14,29 | ||||
| 2026-02-10 | 13F | Td Asset Management Inc | 4.664.372 | 0,72 | 616.342 | -14,31 | ||||
| 2026-02-13 | 13F | Candriam Luxembourg S.C.A. | 42.959 | 1.292,06 | 5.677 | 1.084,97 | ||||
| 2026-01-27 | 13F | GHP Investment Advisors, Inc. | 868 | 0,00 | 114 | -14,93 | ||||
| 2025-10-20 | 13F | Moody Lynn & Lieberson, Llc | 0 | -100,00 | 0 | -100,00 | ||||
| 2026-02-13 | 13F | Quarry LP | 0 | -100,00 | 0 | |||||
| 2026-02-17 | 13F | Jones Financial Companies Lllp | 21.077 | -29,48 | 2.780 | -40,76 | ||||
| 2026-04-08 | 13F | Wealth Enhancement Advisory Services, Llc | 32.792 | 67,96 | 2.958 | 16,14 | ||||
| 2025-11-07 | 13F | Axxcess Wealth Management, Llc | 0 | -100,00 | 0 | -100,00 | ||||
| 2026-02-18 | 13F | Guardian Capital Lp | 2.277 | -72,45 | 301 | -76,62 | ||||
| 2026-04-14 | 13F | Prospera Financial Services Inc | 9.320 | 272,80 | 839 | 154,71 | ||||
| 2026-02-13 | 13F | Smartleaf Asset Management LLC | 762 | 24,10 | 101 | 6,32 | ||||
| 2026-02-17 | 13F | Cresset Asset Management, LLC | 0 | -100,00 | 0 | -100,00 | ||||
| 2026-02-17 | 13F | Principal Street Partners, LLC | 1.524 | -28,65 | 201 | -39,27 | ||||
| 2026-02-17 | 13F | EFG International AG | 21.111 | 2.784 | ||||||
| 2026-02-17 | 13F | Lombard Odier Asset Management (USA) Corp | 10.897 | -1,85 | 1.439 | -16,54 | ||||
| 2026-04-07 | 13F | CoreCap Advisors, LLC | 108 | 0,00 | 10 | -35,71 | ||||
| 2026-02-02 | 13F | Danske Bank A/s | 685 | -10,22 | 91 | -23,08 | ||||
| 2026-02-11 | 13F | Allianz Asset Management GmbH | 159.246 | 22,90 | 21.042 | 4,56 | ||||
| 2026-04-09 | 13F | Pacifica Partners Inc. | 8 | 0,00 | 1 | -100,00 | ||||
| 2026-02-17 | 13F | Quantinno Capital Management LP | 48.052 | 54,11 | 6.341 | 30,93 | ||||
| 2026-02-17 | 13F | D. E. Shaw & Co., Inc. | 238.591 | 175,06 | 31.489 | 133,88 | ||||
| 2026-02-03 | 13F | Denali Advisors Llc | 0 | -100,00 | 0 | |||||
| 2026-03-04 | 13F | Leonteq Securities AG | 0 | -100,00 | 0 | |||||
| 2026-02-18 | 13F | Beacon Pointe Advisors, LLC | 11.404 | -0,32 | 1.504 | -15,36 | ||||
| 2025-10-22 | 13F | Old Second National Bank Of Aurora | 0 | -100,00 | 0 | |||||
| 2026-02-04 | 13F | Pacer Advisors, Inc. | 0 | -100,00 | 0 | |||||
| 2025-11-07 | 13F | Wulff, Hansen & Co. | 0 | -100,00 | 0 | |||||
| 2026-01-30 | 13F | Us Bancorp \de\ | 11.003 | -7,19 | 1.451 | -21,18 | ||||
| 2026-02-11 | 13F | Ing Groep Nv | 4.608 | -80,48 | 608 | -83,44 | ||||
| 2026-02-13 | 13F | American Century Companies Inc | 12.134 | 4,15 | 1.601 | -11,45 | ||||
| 2026-02-06 | 13F | Addison Advisors LLC | 1.031 | -10,81 | 136 | -24,58 | ||||
| 2026-02-13 | 13F | DKRT Investments Corp. | 808.847 | 20,50 | 106.679 | 2,32 | ||||
| 2026-02-13 | 13F | Parkside Financial Bank & Trust | 14 | 0,00 | 2 | -50,00 | ||||
| 2026-02-17 | 13F | Agf Management Ltd | 1.113.665 | 27,96 | 147.323 | 8,65 | ||||
| 2026-02-17 | 13F | Northern Trust Corp | 179.221 | -0,13 | 23.637 | -15,20 | ||||
| 2026-01-21 | 13F | Yousif Capital Management, Llc | 1.776 | -6,08 | 215 | -26,96 | ||||
| 2026-02-13 | 13F | Towarzystwo Funduszy Inwestycyjnych Pzu Sa | 0 | -100,00 | 0 | |||||
| 2026-02-17 | 13F | NEOS Investment Management LLC | 187.659 | 37,65 | 24.750 | 16,88 | ||||
| 2026-01-28 | 13F | SilverOak Wealth Management LLC | 3.476 | 0,00 | 458 | -15,03 | ||||
| 2026-02-05 | 13F | iA Global Asset Management Inc. | 55.307 | 5,97 | 7 | -12,50 | ||||
| 2025-10-23 | 13F | Creative Capital Management Investments LLC | 0 | -100,00 | 0 | -100,00 | ||||
| 2026-01-26 | 13F | Independent Wealth Network Inc. | 1.597 | 211 | ||||||
| 2026-02-12 | 13F | Dimensional Fund Advisors Lp | 220.478 | -0,85 | 29.081 | -15,80 | ||||
| 2026-02-13 | 13F | Public Sector Pension Investment Board | 0 | -100,00 | 0 | |||||
| 2026-02-13 | 13F | Squarepoint Ops LLC | 0 | -100,00 | 0 | |||||
| 2026-02-12 | 13F | Skandinaviska Enskilda Banken AB (publ) | 22.419 | -4,29 | 2.957 | -18,75 | ||||
| 2026-02-13 | 13F | BNP Paribas Asset Management Holding S.A. | 443.929 | 51,74 | 78 | 23,81 | ||||
| 2025-11-14 | 13F | Wetherby Asset Management Inc | 18.520 | 0,00 | 2.877 | -22,77 | ||||
| 2026-01-27 | 13F | Asset Management One Co., Ltd. | 89 | 3,49 | 12 | -15,38 | ||||
| 2026-02-12 | 13F | Colonial Trust Co / SC | 686 | 10,11 | 91 | -6,19 | ||||
| 2026-02-13 | 13F | Healthcare Of Ontario Pension Plan Trust Fund | 328.343 | 153,45 | 43.305 | 115,21 | ||||
| 2025-11-12 | 13F | Brucke Financial, Inc. | 0 | -100,00 | 0 | -100,00 | ||||
| 2025-11-14 | 13F | Cubist Systematic Strategies, LLC | 163.659 | 25.420 | ||||||
| 2026-02-12 | 13F | Bradley Foster & Sargent Inc/ct | 4.178 | 0,00 | 551 | -14,97 | ||||
| 2026-02-17 | 13F | Man Group plc | 94.290 | 47,89 | 12.451 | 25,74 | ||||
| 2026-04-13 | 13F | Creative Financial Designs Inc /adv | 46 | 15,00 | 4 | -20,00 | ||||
| 2026-01-15 | 13F | J. Safra Sarasin Holding AG | 0 | -100,00 | 0 | |||||
| 2026-02-12 | 13F | Nuveen, LLC | 133.658 | 0,00 | 17.661 | -14,92 | ||||
| 2026-02-05 | 13F | Thrivent Financial For Lutherans | 0 | -100,00 | 0 | |||||
| 2026-02-17 | 13F | North Capital, Inc. | 0 | -100,00 | 0 | |||||
| 2026-02-13 | 13F | TritonPoint Partners, LLC | 2.799 | 369 | ||||||
| 2026-02-13 | 13F | Rodgers Brothers Inc. | 16.636 | 0,00 | 2.194 | -15,09 | ||||
| 2026-02-05 | 13F | STF Management LP | 1.899 | -68,89 | 250 | -73,63 | ||||
| 2026-02-06 | 13F | Wisconsin Capital Management Llc | 0 | -100,00 | 0 | |||||
| 2026-02-10 | 13F | Measured Wealth Private Client Group, LLC | 146 | 0,00 | 19 | -13,64 | ||||
| 2026-02-17 | 13F | Jump Financial, LLC | 62.459 | 100,65 | 8.238 | 70,36 | ||||
| 2026-01-16 | 13F | Louisbourg Investments Inc. | 13.720 | 222,37 | 1.813 | 174,70 | ||||
| 2026-02-17 | 13F | Ewing Morris & Co. Investment Partners Ltd. | 4.055 | 41,19 | 542 | 21,52 | ||||
| 2026-02-09 | 13F | Hartland & Co., LLC | 1 | 0 | ||||||
| 2026-04-06 | 13F | CX Institutional | 36 | 0,00 | 0 | |||||
| 2026-02-13 | 13F | Y-Intercept (Hong Kong) Ltd | 32.526 | -67,63 | 4.290 | -72,52 | ||||
| 2026-02-17 | 13F | Alliancebernstein L.p. | 18.484 | -72,38 | 2.438 | -76,55 | ||||
| 2026-01-22 | 13F | Massachusetts Financial Services Co /ma/ | 398.620 | -2,31 | 52.574 | -17,06 | ||||
| 2026-02-12 | 13F | Principal Securities, Inc. | 0 | -100,00 | 0 | -100,00 | ||||
| 2026-02-17 | 13F | BlueSpruce Investments, LP | 0 | -100,00 | 0 | -100,00 | ||||
| 2026-02-12 | 13F | Burkett Asset Management Ltd | 12.787 | 1.690 | ||||||
| 2026-02-17 | 13F | Voloridge Investment Management, Llc | 152.084 | 210,58 | 20.058 | 163,71 | ||||
| 2026-02-17 | 13F | Engineers Gate Manager LP | 0 | -100,00 | 0 | -100,00 | ||||
| 2026-02-05 | 13F | Allworth Financial LP | 700 | 72,84 | 92 | 48,39 | ||||
| 2026-02-17 | 13F | Banco Bilbao Vizcaya Argentaria, S.a. | 0 | -100,00 | 0 | |||||
| 2026-02-13 | 13F | FORA Capital, LLC | 0 | -100,00 | 0 | |||||
| 2026-02-13 | 13F | Neuberger Berman Group LLC | 48.744 | -14,03 | 6.440 | -26,87 | ||||
| 2026-02-19 | 13F | Atomi Financial Group, Inc. | 1.663 | -8,98 | 219 | -22,61 | ||||
| 2025-11-10 | 13F | Cary Street Partners Financial Llc | 0 | -100,00 | 0 | -100,00 | ||||
| 2025-11-03 | 13F | Townsquare Capital Llc | 0 | -100,00 | 0 | -100,00 | ||||
| 2025-11-14 | 13F | Adage Capital Partners Gp, L.l.c. | 0 | -100,00 | 0 | -100,00 | ||||
| 2026-01-26 | 13F | Private Trust Co Na | 744 | 0,00 | 98 | -14,78 | ||||
| 2026-02-13 | 13F | Rafferty Asset Management, LLC | 93.186 | 23,69 | 12.290 | 5,03 | ||||
| 2026-03-06 | 13F | Hsbc Holdings Plc | 42.772 | -74,18 | 5.652 | -78,08 | ||||
| 2025-10-30 | 13F | Oak Hill Wealth Advisors, Llc | 2.463 | 0,00 | 383 | -22,52 | ||||
| 2025-11-14 | 13F | Wolverine Trading, Llc | 5.062 | 791 | ||||||
| 2026-01-27 | 13F | Novem Group | 0 | -100,00 | 0 | |||||
| 2026-02-03 | 13F | RFG Advisory, LLC | 0 | -100,00 | 0 | |||||
| 2026-02-06 | 13F | Larson Financial Group LLC | 21.815 | -4,82 | 2.877 | -19,19 | ||||
| 2025-11-14 | 13F | Wolverine Trading, Llc | Call | 11.100 | 1.734 | |||||
| 2025-11-14 | 13F | Wolverine Trading, Llc | Put | 8.800 | 1.374 | |||||
| 2026-02-13 | 13F | Ubs Asset Management Americas Inc | 152 | 20 | ||||||
| 2026-01-27 | 13F | Grunden Financial Advisory, Inc. | 1.582 | 0,00 | 209 | -15,10 | ||||
| 2026-02-09 | 13F | Hantz Financial Services, Inc. | 667 | 1.011,67 | 0 | |||||
| 2026-02-09 | 13F | Legal & General Group Plc | 984.559 | -3,76 | 130.098 | -18,12 | ||||
| 2026-02-17 | 13F | Advisory Services Network, LLC | 0 | -100,00 | 0 | |||||
| 2026-02-17 | 13F | Canada Pension Plan Investment Board | 945.193 | 582,11 | 124.736 | 479,87 | ||||
| 2025-11-07 | 13F | Ontario Teachers Pension Plan Board | 0 | -100,00 | 0 | -100,00 | ||||
| 2025-11-10 | 13F | Greenland Capital Management LP | Put | 0 | -100,00 | 0 | -100,00 | |||
| 2026-02-17 | 13F | MIRAE ASSET GLOBAL ETFS HOLDINGS Ltd. | 568.832 | 11,44 | 75.031 | -5,38 | ||||
| 2026-02-17 | 13F | Shelton Capital Management | 50.725 | 2,02 | 6.690 | -13,38 | ||||
| 2026-02-10 | 13F | Meramec Financial Planners, LLC | 63 | 6 | ||||||
| 2026-02-12 | 13F | Brown Brothers Harriman & Co | 623 | 20,74 | 82 | 2,50 | ||||
| 2026-02-17 | 13F | Public Employees Retirement System Of Ohio | 10.000 | -13,01 | 1.321 | -25,99 | ||||
| 2026-04-13 | 13F | E Fund Management Co., Ltd. | 14.195 | 1.277 | ||||||
| 2026-01-29 | 13F | Quent Capital, LLC | 150 | 0,00 | 20 | -17,39 | ||||
| 2026-02-17 | 13F | Farringdon Capital, Ltd. | 0 | -100,00 | 0 | |||||
| 2025-10-27 | 13F | N.E.W. Advisory Services LLC | 0 | -100,00 | 0 | |||||
| 2026-03-16 | 13F/A | Rockefeller Capital Management L.P. | 4.478 | -16,19 | 591 | -28,92 | ||||
| 2026-04-14 | 13F | Clean Yield Group | 54 | -75,00 | 5 | -85,71 | ||||
| 2026-02-10 | 13F | Bridges Investment Management Inc | 2.207 | 0,00 | 291 | -14,91 | ||||
| 2026-01-29 | 13F | UMA Financial Services, Inc. | 1.081 | 0,00 | 143 | -14,97 | ||||
| 2025-10-31 | 13F | National Asset Management, Inc. | 0 | -100,00 | 0 | -100,00 | ||||
| 2026-01-20 | 13F | Ascent Group, LLC | 0 | -100,00 | 0 | |||||
| 2026-02-17 | 13F | Strategic Investment Advisors / MI | 0 | -100,00 | 0 | |||||
| 2026-03-04 | 13F | SHP Wealth Management | 13 | 2 | ||||||
| 2026-02-18 | 13F | Garton & Associates Financial Advisors LLC | 33 | 4 | ||||||
| 2026-01-29 | 13F | Pictet Asset Management Holding SA | 359.050 | 55,96 | 47.452 | 32,71 | ||||
| 2026-02-13 | 13F | Toroso Investments, LLC | 3.610 | 35,21 | 476 | 14,98 | ||||
| 2025-11-10 | 13F | Greenland Capital Management LP | 0 | -100,00 | 0 | -100,00 | ||||
| 2026-02-04 | 13F | Atlantic Union Bankshares Corp | 48 | 0,00 | 6 | -14,29 | ||||
| 2026-02-17 | 13F | Imprint Wealth LLC | 8 | -69,23 | 1 | -75,00 | ||||
| 2025-11-13 | 13F | Bridgewater Associates, LP | 0 | -100,00 | 0 | |||||
| 2026-02-17 | 13F | Guardian Partners Inc. | 0 | -100,00 | 0 | |||||
| 2026-02-17 | 13F | SIG North Trading, ULC | 0 | -100,00 | 0 | |||||
| 2026-02-09 | 13F | Arista Wealth Management, LLC | 4.780 | 0,00 | 630 | -15,09 | ||||
| 2026-02-13 | 13F | Neo Ivy Capital Management | 16.327 | 2.153 | ||||||
| 2026-02-10 | 13F | Daiwa Securities Group Inc. | 39.878 | 9,06 | 5 | 0,00 | ||||
| 2026-01-26 | 13F | Mirae Asset Global Investments Co., Ltd. | 142.570 | 22,43 | 18.804 | 3,96 | ||||
| 2026-02-12 | 13F | Rossby Financial, LCC | 18 | -98,29 | 2 | -98,75 | ||||
| 2026-02-13 | 13F | USS Investment Management Ltd | 25.478 | 7,80 | 3.381 | -8,10 | ||||
| 2026-01-27 | 13F | Brighton Jones Llc | 0 | -100,00 | 0 | |||||
| 2026-02-17 | 13F | Creative Planning | 21.097 | 1,52 | 2.783 | -13,79 | ||||
| 2026-02-12 | 13F | Campbell & CO Investment Adviser LLC | 30.507 | 35,05 | 4.024 | 14,68 | ||||
| 2026-01-30 | 13F | CBOE Vest Financial, LLC | 26.429 | 110,34 | 3.486 | 78,63 | ||||
| 2026-02-13 | 13F | Natixis | 11.378 | 56,85 | 1.501 | 33,21 | ||||
| 2025-11-07 | 13F | Crestwood Advisors Group LLC | 0 | -100,00 | 0 | -100,00 | ||||
| 2026-03-20 | 13F | Purpose Unlimited Inc. | 830 | 110 | ||||||
| 2026-01-29 | 13F | Concurrent Investment Advisors, LLC | 3.247 | 27,88 | 428 | 8,63 | ||||
| 2026-02-04 | 13F | Meridian Wealth Management, LLC | 25.762 | 0,89 | 3.398 | -14,35 | ||||
| 2026-02-17 | 13F | Balyasny Asset Management Llc | 29.556 | 3.901 | ||||||
| 2025-11-14 | 13F | Beck Bode, LLC | 0 | -100,00 | 0 | |||||
| 2026-02-17 | 13F | SIG North Trading, ULC | Call | 20.600 | 19,08 | 2.717 | 1,08 | |||
| 2026-02-17 | 13F | SIG North Trading, ULC | Put | 15.900 | -13,11 | 2.097 | -26,21 | |||
| 2026-02-12 | 13F | Brinker Capital Investments, LLC | 9.000 | -31,17 | 1.187 | -41,61 | ||||
| 2026-02-11 | 13F | Dorsey & Whitney Trust CO LLC | 0 | -100,00 | 0 | |||||
| 2026-01-23 | 13F | Dara Capital Us, Inc. | 3.285 | 433 | ||||||
| 2026-04-13 | 13F | JCIC Asset Management Inc. | 0 | -100,00 | 0 | |||||
| 2026-01-21 | 13F | Greenleaf Trust | 7.327 | 2,46 | 966 | -12,97 | ||||
| 2025-11-14 | 13F | ExodusPoint Capital Management, LP | 0 | -100,00 | 0 | -100,00 | ||||
| 2026-01-16 | 13F | Louisiana State Employees Retirement System | 29.800 | -9,42 | 3.930 | -23,09 | ||||
| 2026-02-17 | 13F | Laird Norton Trust Company, Llc | 24.197 | 3.191 | ||||||
| 2026-02-17 | 13F | Norinchukin Bank, The | 14.861 | 17,76 | 1.960 | 0,00 | ||||
| 2026-02-13 | 13F | Victory Capital Management Inc | 200.929 | -30,65 | 26.501 | -41,12 | ||||
| 2026-01-21 | 13F | Quilter Plc | 4.553 | -20,86 | 601 | -32,81 | ||||
| 2026-02-04 | 13F | Plato Investment Management Ltd | 17.535 | 5.967,47 | 2.328 | 5.190,91 | ||||
| 2026-02-17 | 13F | Millennium Management Llc | 139.500 | 8,84 | 18.399 | -7,55 | ||||
| 2026-02-10 | 13F | Thoroughbred Financial Services, Llc | 0 | -100,00 | 0 | |||||
| 2026-01-30 | 13F | Laurel Wealth Advisors LLC | 62 | 8 | ||||||
| 2026-02-11 | 13F | Dearborn Partners Llc | 194.025 | 22,35 | 25.590 | 3,89 | ||||
| 2026-02-13 | 13F | Barclays Plc | 690.477 | 34,67 | 91.067 | 14,35 | ||||
| 2026-01-29 | 13F | Anchyra Partners Llc | 2.249 | 297 | ||||||
| 2026-02-17 | 13F | Concentric Capital Strategies, LP | 0 | -100,00 | 0 | |||||
| 2025-11-14 | 13F | Moore Capital Management, Lp | 0 | -100,00 | 0 | -100,00 | ||||
| 2026-02-10 | 13F | Gulf International Bank (UK) Ltd | 7.670 | 0,00 | 1 | 0,00 | ||||
| 2026-01-15 | 13F | Mn Services Vermogensbeheer B.V. | 60.391 | 1,30 | 8 | -22,22 | ||||
| 2026-02-13 | 13F | Financial Network Wealth Advisors LLC | 730 | 38,00 | 96 | 17,07 | ||||
| 2025-10-21 | 13F | Financiere des Professionnels - Fonds d,investissement inc. | 0 | -100,00 | 0 | -100,00 | ||||
| 2026-01-16 | 13F | Park Edge Advisors, LLC | 0 | -100,00 | 0 | |||||
| 2026-02-17 | 13F | BCV Asset Management Inc. | 301.925 | 36.675 | ||||||
| 2026-02-17 | 13F | Nomura Holdings Inc | 72.822 | 3,72 | 9.604 | -11,93 | ||||
| 2026-04-08 | 13F | Community Financial Services Group, LLC | 60 | 5 | ||||||
| 2025-10-30 | 13F | Gibbs Wealth Management | 0 | -100,00 | 0 | -100,00 | ||||
| 2026-02-17 | 13F | Toronto Dominion Bank | 596.153 | 21,87 | 78.678 | 3,48 | ||||
| 2026-04-08 | 13F | E Fund Management (Hong Kong) Co., Ltd. | 1.542 | 7,46 | 139 | -11,54 | ||||
| 2026-02-17 | 13F | Schonfeld Strategic Advisors LLC | 9.941 | 1.311 | ||||||
| 2026-02-17 | 13F | Toronto Dominion Bank | Put | 1.900 | -81,73 | 251 | -84,52 | |||
| 2026-02-17 | 13F | Toronto Dominion Bank | Call | 3.200 | 422 | |||||
| 2026-02-10 | 13F | Nomura Asset Management Co Ltd | 17.730 | 13,34 | 2.338 | -3,75 | ||||
| 2025-11-14 | 13F | Axa S.a. | 0 | -100,00 | 0 | -100,00 | ||||
| 2026-02-17 | 13F | Susquehanna International Group, Llp | 51.457 | -78,55 | 6.787 | -81,79 | ||||
| 2026-01-23 | 13F | Westside Investment Management, Inc. | 338 | 0,00 | 43 | -17,65 | ||||
| 2026-02-17 | 13F | Susquehanna International Group, Llp | Put | 29.900 | -85,10 | 3.944 | -87,35 | |||
| 2026-01-14 | 13F | Spire Wealth Management | 387 | -62,32 | 51 | -67,92 | ||||
| 2026-02-02 | 13F | Cornerstone Planning Group LLC | 1.188 | 42,45 | 139 | 17,80 | ||||
| 2026-02-03 | 13F | Crossmark Global Holdings, Inc. | 4.247 | -51,67 | 560 | -58,94 | ||||
| 2026-02-17 | 13F | Susquehanna International Group, Llp | Call | 39.600 | -30,28 | 5.223 | -40,81 | |||
| 2026-02-04 | 13F | Kepler Cheuvreux (Suisse) SA | 0 | -100,00 | 0 | -100,00 | ||||
| 2025-11-07 | 13F | Shell Asset Management Co | 18.928 | -55,26 | 3 | -75,00 | ||||
| 2026-02-12 | 13F | JPL Wealth Management, LLC | 27.311 | -7,32 | 3.602 | -21,30 | ||||
| 2026-02-17 | 13F | SIH Partners, LLLP | 1.856 | 245 | ||||||
| 2025-10-15 | 13F | Pensionmark Financial Group, Llc | 0 | -100,00 | 0 | -100,00 | ||||
| 2025-11-13 | 13F | Prudential Financial Inc | 0 | -100,00 | 0 | -100,00 | ||||
| 2026-01-13 | 13F | Norden Group Llc | 1.920 | 253 | ||||||
| 2025-11-17 | 13F | Laurion Capital Management LP | 0 | -100,00 | 0 | -100,00 | ||||
| 2026-02-10 | 13F | MUFG Securities EMEA plc | 350.000 | 46.198 | ||||||
| 2026-02-13 | 13F | Morgan Stanley | 2.802.312 | 31,16 | 369.597 | 11,37 | ||||
| 2026-02-06 | 13F | Pnc Financial Services Group, Inc. | 9.704 | -9,33 | 1.280 | -23,04 | ||||
| 2025-11-14 | 13F | Balyasny Asset Management Llc | Call | 0 | -100,00 | 0 | -100,00 | |||
| 2025-11-05 | 13F | SOUTH STATE Corp | 0 | -100,00 | 0 | -100,00 | ||||
| 2026-04-06 | 13F | GAMMA Investing LLC | 1.397 | 25,29 | 126 | -14,97 | ||||
| 2026-01-22 | 13F | Vista Investment Partners Ii, Llc | 16.638 | -0,83 | 2.194 | -15,81 | ||||
| 2025-10-21 | 13F | Jarislowsky, Fraser Ltd | 2.886.701 | -4,12 | 448.337 | -25,80 | ||||
| 2026-02-05 | 13F | Td Private Client Wealth Llc | 7 | 1 | ||||||
| 2026-01-16 | 13F | Wealth Advisory Solutions, LLC | 0 | -100,00 | 0 | |||||
| 2026-01-26 | 13F | JNBA Financial Advisors | 602 | 0,00 | 79 | -15,05 | ||||
| 2026-02-12 | 13F | Jane Street Group, Llc | 7.751 | -95,72 | 1.022 | -96,37 | ||||
| 2026-02-12 | 13F | Steward Partners Investment Advisory, Llc | 1.618 | 9,40 | 213 | -6,99 | ||||
| 2026-02-10 | 13F | Connor, Clark & Lunn Investment Management Ltd. | 1.259.901 | -38,42 | 166.254 | -47,66 | ||||
| 2026-02-02 | 13F | Benjamin Edwards Inc | 291.641 | 43,27 | 38.541 | 21,89 | ||||
| 2026-02-12 | 13F | Jane Street Group, Llc | Put | 22.200 | 113,46 | 2.928 | 81,24 | |||
| 2026-02-17 | 13F | Fmr Llc | 4.703.318 | 11,12 | 620.678 | -5,56 | ||||
| 2026-02-12 | 13F | Jane Street Group, Llc | Call | 2.200 | 290 | |||||
| 2026-02-12 | 13F | Federation des caisses Desjardins du Quebec | 668.366 | -0,64 | 88.086 | -15,41 | ||||
| 2026-01-06 | 13F | Penbrook Management LLC | 24.948 | 0,40 | 3.297 | -14,59 | ||||
| 2026-02-02 | 13F | Oppenheimer & Co Inc | 8.998 | 2,27 | 1.187 | -13,18 | ||||
| 2026-02-04 | 13F | Sentry Investment Management Llc | 0 | -100,00 | 0 | |||||
| 2025-11-14 | 13F | Capula Management Ltd | 0 | -100,00 | 0 | |||||
| 2026-01-21 | 13F | Cidel Asset Management Inc | 48.285 | -63,91 | 6.380 | -69,30 | ||||
| 2026-02-13 | 13F | Dixon Mitchell Investment Counsel Inc. | 210.645 | -1,24 | 27.834 | -15,97 | ||||
| 2026-02-17 | 13F | Fullerton Fund Management Co Ltd | 1.700 | 225 | ||||||
| 2026-01-23 | 13F | Tyche Wealth Partners LLC | 2.824 | 372 | ||||||
| 2026-01-23 | 13F | Rsm Us Wealth Management Llc | 2.212 | -2,98 | 294 | -17,23 | ||||
| 2026-02-13 | 13F | Kempen Capital Management N.v. | 31.265 | -8,40 | 4.127 | -22,14 | ||||
| 2026-01-27 | 13F | Bayforest Capital Ltd | 827 | 29,62 | 109 | 10,10 | ||||
| 2026-02-12 | 13F | Lansforsakringar Fondforvaltning AB (publ) | 33.226 | 1,07 | 4.390 | -14,01 | ||||
| 2026-02-17 | 13F | Russell Investments Group, Ltd. | 88.968 | 46,06 | 11.788 | 24,24 | ||||
| 2026-02-17 | 13F | Raymond James Financial Inc | 310.088 | 14,19 | 40.898 | -3,04 | ||||
| 2026-01-21 | 13F | Brown Shipley& Co Ltd | 192 | 0,00 | 25 | -13,79 | ||||
| 2026-02-13 | 13F | Baird Financial Group, Inc. | 26.389 | -39,65 | 3.480 | -48,76 | ||||
| 2025-11-12 | 13F | NewSquare Capital LLC | 0 | -100,00 | 0 | |||||
| 2026-02-17 | 13F | Optiver Holding B.V. | 1.296 | 171 | ||||||
| 2026-01-22 | 13F | Bear Mountain Capital, Inc. | 0 | -100,00 | 0 | |||||
| 2026-01-21 | 13F | Albion Financial Group /ut | 17 | 0,00 | 2 | 0,00 | ||||
| 2026-02-09 | 13F | Waratah Capital Advisors Ltd. | 0 | -100,00 | 0 | |||||
| 2026-02-04 | 13F | Swiss Life Asset Management Ltd | 24.390 | 9,22 | 3.218 | -7,32 | ||||
| 2026-02-02 | 13F | Varma Mutual Pension Insurance Co | 63.706 | -0,39 | 8.418 | -15,24 | ||||
| 2026-02-11 | 13F | Picton Mahoney Asset Management | 218.799 | -36,19 | 28.915 | 54.454,72 | ||||
| 2025-11-14 | 13F | Seldon Capital Lp | 0 | -100,00 | 0 | |||||
| 2026-01-29 | 13F | China Universal Asset Management Co., Ltd. | 12.588 | 5,80 | 1.660 | -10,17 | ||||
| 2026-02-10 | 13F | Forsta Ap-fonden | 35.988 | 0,28 | 4.755 | -14,68 | ||||
| 2026-02-11 | 13F | Empowered Funds, LLC | 231 | 30 | ||||||
| 2026-02-18 | 13F | Mackenzie Financial Corp | 2.377.940 | -0,02 | 315.210 | -14,63 | ||||
| 2026-02-06 | 13F | ProShare Advisors LLC | 691.067 | 41,54 | 91.145 | 20,18 | ||||
| 2026-02-10 | 13F | Natixis Advisors, L.p. | 13.450 | -18,11 | 2 | -50,00 | ||||
| 2026-02-17 | 13F | O'Domhnaill Enterprises, Inc. | 23 | 3 | ||||||
| 2026-02-11 | 13F | Group One Trading, L.p. | 140 | 18 | ||||||
| 2026-03-09 | 13F/A | CI Private Wealth, LLC | 20.014 | 5,85 | 2.640 | -10,12 | ||||
| 2026-02-13 | 13F | Centiva Capital, LP | 0 | -100,00 | 0 | |||||
| 2026-02-09 | 13F | Harbour Investments, Inc. | 107 | 28,92 | 14 | 16,67 | ||||
| 2026-02-13 | 13F | Verition Fund Management LLC | 0 | -100,00 | 0 | |||||
| 2025-11-21 | 13F/A | CIBC Bancorp USA Inc. | 16.501 | 2.563 | ||||||
| 2026-02-13 | 13F | Bank Of Nova Scotia | 310.413 | -28,68 | 40.962 | -39,42 | ||||
| 2026-02-12 | 13F | CIBC Private Wealth Group, LLC | 1.208 | -39,87 | 159 | -49,04 | ||||
| 2026-01-16 | 13F | Omnia Family Wealth, LLC | 1.754 | 0,00 | 232 | -15,07 | ||||
| 2026-02-17 | 13F | Ameriflex Group, Inc. | 15 | -50,00 | 2 | -75,00 | ||||
| 2026-02-04 | 13F | Midwest Trust Co | 1.859 | -1,27 | 245 | -16,10 | ||||
| 2025-11-14 | 13F | Skopos Labs, Inc. | 0 | -100,00 | 0 | |||||
| 2026-02-06 | 13F | Motco | 998 | 0,00 | 132 | -15,48 | ||||
| 2026-02-13 | 13F | State Street Corp | 192.037 | 1,88 | 25.328 | -13,49 | ||||
| 2026-02-13 | 13F | Ieq Capital, Llc | 7.671 | 74,90 | 1.012 | 48,46 | ||||
| 2026-02-13 | 13F | PJT Investments Corp. | 530.297 | 0,00 | 69.941 | -15,09 | ||||
| 2026-02-03 | 13F | SBI Securities Co., Ltd. | 291 | -1,02 | 38 | -15,56 | ||||
| 2026-02-06 | 13F | HighTower Advisors, LLC | 10.607 | 5,35 | 1.400 | -10,49 | ||||
| 2026-02-11 | 13F | Deutsche Bank Ag\ | 630.639 | 56,61 | 83.175 | 32,98 | ||||
| 2026-02-11 | 13F | Metis Global Partners, LLC | 8.297 | -25,31 | 1.095 | -36,54 | ||||
| 2026-02-26 | 13F | TD Capital Management LLC | 45 | 0,00 | 6 | -16,67 | ||||
| 2026-01-20 | 13F | First American Bank | 22.069 | -1,66 | 2.911 | -16,50 | ||||
| 2026-02-09 | 13F | Keating Financial Advisory Services, Inc. | 79 | 10 | ||||||
| 2025-11-10 | 13F | Kovitz Investment Group Partners, LLC | 0 | -100,00 | 0 | |||||
| 2026-02-06 | 13F | Banque Cantonale Vaudoise | 78 | -26,42 | 10 | |||||
| 2026-02-13 | 13F | Caitong International Asset Management Co., Ltd | 123 | -90,43 | 16 | -91,96 | ||||
| 2026-04-13 | 13F | Lee Financial Co | 6.169 | 555 | ||||||
| 2026-01-27 | 13F | Gf Fund Management Co. Ltd. | 93.832 | 14,43 | 12.376 | -2,84 | ||||
| 2026-02-06 | 13F | Bare Financial Services, Inc | 6 | -84,62 | 1 | -100,00 | ||||
| 2025-11-14 | 13F | Royal Bank Of Canada | Call | 0 | -100,00 | 0 | -100,00 | |||
| 2026-02-05 | 13F | Atria Investments Llc | 0 | -100,00 | 0 | |||||
| 2026-02-10 | 13F | Envestnet Asset Management Inc | 260.397 | -15,82 | 34.345 | -28,52 | ||||
| 2026-02-11 | 13F | Fiera Capital Corp | 1.797.209 | -21,10 | 237.248 | -32,90 | ||||
| 2026-02-13 | 13F | Walleye Trading LLC | 0 | -100,00 | 0 | |||||
| 2025-11-12 | 13F | Catalyst Funds Management Pty Ltd | 0 | -100,00 | 0 | |||||
| 2025-10-15 | 13F | Stephens Consulting, LLC | 0 | -100,00 | 0 | -100,00 | ||||
| 2026-02-13 | 13F | Walleye Trading LLC | Put | 0 | -100,00 | 0 | ||||
| 2026-02-13 | 13F | Walleye Trading LLC | Call | 0 | -100,00 | 0 | ||||
| 2026-02-13 | 13F | Bridgefront Capital, LLC | 3.334 | 440 | ||||||
| 2026-01-28 | 13F | HB Wealth Management, LLC | 0 | -100,00 | 0 | -100,00 | ||||
| 2026-02-13 | 13F | Evelyn Partners Investment Management Services Ltd | 3.124 | 5,36 | 412 | -10,43 | ||||
| 2026-02-13 | 13F | Evelyn Partners Investment Management (Europe) Ltd | 393 | 0,00 | 52 | -16,39 | ||||
| 2026-04-02 | 13F | Noble Wealth Management PBC | 0 | -100,00 | 0 | |||||
| 2026-02-13 | 13F | Dynamic Technology Lab Private Ltd | 9.090 | 16,69 | 1.199 | -0,91 | ||||
| 2026-01-26 | 13F | Cwm, Llc | 38.225 | 0,92 | 5 | 0,00 | ||||
| 2026-02-11 | 13F | Janney Montgomery Scott LLC | 6.733 | -88,63 | 1 | -100,00 | ||||
| 2026-02-17 | 13F | Investment Management Corp of Ontario | 16.442 | 229,43 | 2.169 | 179,74 | ||||
| 2026-01-30 | 13F | Catalytic Wealth RIA, LLC | 0 | -100,00 | 0 | |||||
| 2025-11-14 | 13F | Aquatic Capital Management LLC | 0 | -100,00 | 0 | -100,00 | ||||
| 2025-11-14 | 13F | Brevan Howard Capital Management LP | 0 | -100,00 | 0 | -100,00 | ||||
| 2026-01-29 | 13F | Munich Reinsurance Co Stock Corp in Munich | 32.282 | 4.292 | ||||||
| 2026-02-11 | 13F | Cerity Partners LLC | 111.192 | 191,69 | 14.665 | 147,68 | ||||
| 2026-01-14 | 13F | Jfs Wealth Advisors, Llc | 19 | -34,48 | 3 | -50,00 | ||||
| 2025-11-20 | 13F | First Affirmative Financial Network | 2.354 | -6,18 | 366 | -27,58 | ||||
| 2026-02-13 | 13F | Woodbridge CO LTD | 300.694.046 | 0,02 | 39.658.538 | -15,07 | ||||
| 2026-02-06 | 13F | Cullen/frost Bankers, Inc. | 306 | 22,89 | 40 | 5,26 | ||||
| 2026-01-12 | 13F | Contravisory Investment Management, Inc. | 0 | -100,00 | 0 | |||||
| 2026-02-11 | 13F | J.Safra Asset Management Corp | 422 | 56 | ||||||
| 2026-02-12 | 13F | Bank Of Montreal /can/ | Call | 124.000 | -76,52 | 16.364 | -80,04 | |||
| 2026-04-07 | 13F | Signaturefd, Llc | 6.424 | -26,69 | 578 | -49,96 | ||||
| 2026-02-12 | 13F | Bank Of Montreal /can/ | 6.098.897 | -0,21 | 804.864 | -15,17 | ||||
| 2026-02-17 | 13F | SummitTX Capital, L.P. | 5.919 | 358,13 | 781 | 290,00 | ||||
| 2026-02-03 | 13F | Ballentine Partners, LLC | 5.080 | 0,79 | 670 | -14,32 | ||||
| 2025-11-12 | 13F | AlphaCore Capital LLC | 0 | -100,00 | 0 | |||||
| 2026-02-10 | 13F | Private Wealth Asset Management, LLC | 568 | -0,87 | 75 | -16,85 | ||||
| 2026-01-22 | 13F | Financial Consulate, Inc | 3 | 0 | ||||||
| 2025-11-12 | 13F | Blair William & Co/il | 0 | -100,00 | 0 | -100,00 | ||||
| 2026-02-10 | 13F | Quantbot Technologies LP | 13.759 | -57,15 | 1.815 | -63,63 | ||||
| 2026-02-17 | 13F | Numerai GP LLC | 52.542 | 208,18 | 6.930 | 161,67 | ||||
| 2026-04-09 | 13F | Vista Investment Partners Llc | 0 | -100,00 | 0 | |||||
| 2026-02-10 | 13F | Lido Advisors, LLC | 45.808 | 1,32 | 6.577 | -6,34 | ||||
| 2026-02-12 | 13F | Aviva Plc | 131.203 | 5,46 | 17.328 | -10,22 | ||||
| 2026-02-13 | 13F | Beutel, Goodman & Co Ltd. | 60.738 | -4,67 | 8 | -11,11 | ||||
| 2026-04-01 | 13F | Bangor Savings Bank | 0 | -100,00 | 0 | |||||
| 2026-02-17 | 13F | Two Sigma Investments, Lp | 307.479 | 15,94 | 40.553 | -1,55 | ||||
| 2026-04-13 | 13F | CGC Financial Services, LLC | 315 | 0,00 | 28 | -31,71 | ||||
| 2026-02-11 | 13F | West Family Investments, Inc. | 4.320 | 0,00 | 570 | -15,20 | ||||
| 2026-01-12 | 13F | Avanza Fonder AB | 16.896 | 94,74 | 3.060 | 63,29 | ||||
| 2025-11-14 | 13F | Williamson Legacy Group, LLC | 0 | -100,00 | 0 | -100,00 | ||||
| 2025-10-31 | 13F | Whittier Trust Co Of Nevada Inc | 0 | -100,00 | 0 | -100,00 | ||||
| 2026-02-13 | 13F | Entropy Technologies, LP | 18.709 | 137,70 | 2.468 | 101,88 | ||||
| 2026-02-17 | 13F | Lombard Odier Asset Management (Switzerland) SA | 15.351 | -40,62 | 2.026 | -49,54 | ||||
| 2026-02-17 | 13F | Twinbeech Capital Lp | 0 | -100,00 | 0 | |||||
| 2026-02-05 | 13F | Bessemer Group Inc | 22.268 | -10,88 | 3 | -33,33 | ||||
| 2026-02-11 | 13F | Curio Wealth, Llc | 163 | 0,00 | 22 | -16,00 | ||||
| 2026-02-12 | 13F | Renaissance Technologies Llc | 136.395 | 197,84 | 17.989 | 152,90 | ||||
| 2026-02-06 | 13F | Griffin Asset Management, Inc. | 12.471 | 1,55 | 1.645 | -13,79 | ||||
| 2026-01-21 | 13F | Flagship Harbor Advisors, Llc | 1 | 0 | ||||||
| 2026-02-18 | 13F | GWM Advisors LLC | 4.811 | -9,43 | 635 | -23,15 | ||||
| 2025-11-10 | 13F | Marks Group Wealth Management, Inc | 0 | -100,00 | 0 | -100,00 | ||||
| 2026-02-13 | 13F | PCM Encore, LLC | 2.789 | 368 | ||||||
| 2026-02-10 | 13F | State of Wyoming | 836 | 37,95 | 110 | 17,02 | ||||
| 2026-02-12 | 13F | Bank Of Montreal /can/ | Put | 0 | -100,00 | 0 | -100,00 | |||
| 2026-02-17 | 13F | Ameriprise Financial Inc | 47.612 | -61,09 | 6.407 | -66,62 | ||||
| 2025-11-14 | 13F | Strategic Wealth Partners, Ltd. | 7 | 0,00 | 1 | 0,00 | ||||
| 2026-01-12 | 13F | DAVENPORT & Co LLC | 2.301 | 0,00 | 304 | -14,85 | ||||
| 2026-02-13 | 13F | Rhumbline Advisers | 3.204 | -9,70 | 423 | -23,41 | ||||
| 2026-01-14 | 13F | Clarius Group, LLC | 1.782 | 0,00 | 235 | -14,86 | ||||
| 2026-02-02 | 13F | Truist Financial Corp | 2.918 | -56,43 | 385 | -63,08 | ||||
| 2026-02-12 | 13F | Timmons Wealth Management, LLC | 321 | 42 | ||||||
| 2026-02-12 | 13F | Wealthspire Advisors, LLC | 0 | -100,00 | 0 | |||||
| 2026-02-06 | 13F | Cumberland Partners Ltd | 19.022 | 38,46 | 2.513 | 17,82 | ||||
| 2026-02-13 | 13F | Ingalls & Snyder Llc | 5.601 | -1,41 | 1 | |||||
| 2026-02-10 | 13F | Norges Bank | 1.162.529 | 153.417 | ||||||
| 2026-01-30 | 13F/A | M&t Bank Corp | 2.392 | 0,00 | 315 | -15,09 | ||||
| 2026-02-09 | 13F | Huntington National Bank | 817 | 0,00 | 108 | -15,08 | ||||
| 2026-02-06 | 13F | Profund Advisors Llc | 35.033 | 7,52 | 4.621 | -8,71 | ||||
| 2026-02-03 | 13F | Mitsubishi UFJ Kokusai Asset Management Co., Ltd. | 38.333 | 6,45 | 4.844 | -13,41 | ||||
| 2026-02-13 | 13F | BRITISH COLUMBIA INVESTMENT MANAGEMENT Corp | 399.341 | 269,90 | 52.701 | 214,46 | ||||
| 2026-02-17 | 13F | Select Equity Group, L.P. | 0 | -100,00 | 0 | -100,00 | ||||
| 2025-10-31 | 13F | BCJ Capital Management, LLC | 0 | -100,00 | 0 | -100,00 | ||||
| 2026-04-07 | 13F | Farther Finance Advisors, LLC | 3.572 | -10,86 | 315 | -40,53 | ||||
| 2026-04-14 | 13F | Beacon Investment Advisory Services, Inc. | 469 | 42 | ||||||
| 2026-02-12 | 13F | Empower Advisory Group, LLC | 4.640 | -4,57 | 613 | -18,81 | ||||
| 2026-02-13 | 13F | Pathstone Holdings, LLC | 14.685 | -43,00 | 1.937 | -51,61 | ||||
| 2026-02-13 | 13F | Charles Schwab Investment Management Inc | 339.308 | 2,14 | 44.836 | -13,10 | ||||
| 2025-11-03 | 13F | AustralianSuper Pty Ltd | 128.599 | 19.964 | ||||||
| 2025-10-29 | 13F | Fiduciary Family Office, Llc | 0 | -100,00 | 0 | -100,00 | ||||
| 2026-04-13 | 13F | Hm Payson & Co | 0 | -100,00 | 0 | |||||
| 2025-11-10 | 13F | Cary Street Partner Investment Advisory Llc | 0 | -100,00 | 0 | -100,00 | ||||
| 2026-01-08 | 13F | Value Partners Investments Inc. | 5.969 | 8,08 | 789 | -8,05 | ||||
| 2026-01-13 | 13F | Capital Investment Advisors, LLC | 0 | -100,00 | 0 | |||||
| 2026-02-03 | 13F | International Assets Investment Management, Llc | 0 | -100,00 | 0 | |||||
| 2025-11-07 | 13F | Wealth Alliance | 0 | -100,00 | 0 | |||||
| 2026-02-11 | 13F | CenterBook Partners LP | 3.744 | 494 | ||||||
| 2026-01-28 | 13F | Financial Perspectives, Inc | 400 | 0,00 | 53 | -16,13 | ||||
| 2026-01-13 | 13F | Mather Group, Llc. | 0 | -100,00 | 0 | |||||
| 2026-04-02 | 13F | Ares Financial Consulting, LLC | 26 | 0,00 | 2 | -33,33 | ||||
| 2025-11-05 | 13F | Portside Wealth Group, LLC | 0 | -100,00 | 0 | -100,00 | ||||
| 2025-10-23 | 13F | Seneca Financial Advisors LLC | 0 | -100,00 | 0 | |||||
| 2026-04-01 | 13F | Laurus Investment Counsel Inc. | 1.265 | 0,00 | 114 | -31,93 | ||||
| 2026-02-13 | 13F | Walleye Capital LLC | 0 | -100,00 | 0 | |||||
| 2026-02-13 | 13F | National Bank Of Canada /fi/ | 1.662.274 | -1,61 | 218.556 | -16,46 | ||||
| 2026-02-13 | 13F | Integrated Wealth Concepts LLC | 0 | -100,00 | 0 | -100,00 | ||||
| 2026-01-27 | 13F | TD Waterhouse Canada Inc. | 230.164 | 13,90 | 30.316 | -1,82 | ||||
| 2026-02-04 | 13F | Ameritas Advisory Services, LLC | 0 | -100,00 | 0 | |||||
| 2026-02-13 | 13F | LCC Family Corp. | 3.639.067 | -10,00 | 479.957 | -23,58 | ||||
| 2026-02-13 | 13F | Wells Fargo & Company/mn | 149.457 | 1,62 | 19.712 | -13,72 | ||||
| 2026-02-10 | 13F/A | Northwestern Mutual Wealth Management Co | 4.802 | 51,34 | 633 | 28,66 | ||||
| 2025-10-30 | 13F | Brandywine Oak Private Wealth Llc | 0 | -100,00 | 0 | |||||
| 2026-01-23 | 13F | Westbourne Investment Advisors, Inc. | 1.939 | 0,00 | 256 | -15,28 | ||||
| 2026-02-06 | 13F | Gsa Capital Partners Llp | 4.641 | 34,87 | 1 | |||||
| 2026-02-10 | 13F | Hillsdale Investment Management Inc. | 724 | -95,91 | 96 | -96,54 | ||||
| 2026-02-17 | 13F | XTX Topco Ltd | 0 | -100,00 | 0 | |||||
| 2026-02-11 | 13F | LPL Financial LLC | 31.594 | 8,05 | 4.167 | -8,26 | ||||
| 2026-02-17 | 13F | PDT Partners, LLC | 0 | -100,00 | 0 | |||||
| 2026-01-08 | 13F | Pine Haven Investment Counsel, Inc | 0 | -100,00 | 0 | |||||
| 2026-01-23 | 13F | Diversify Advisory Services, LLC | 0 | -100,00 | 0 | -100,00 | ||||
| 2026-02-03 | 13F | Generali Asset Management SPA SGR | 11.585 | 5,19 | 2.098 | -11,81 | ||||
| 2026-02-13 | 13F | Walleye Capital LLC | Call | 0 | -100,00 | 0 | ||||
| 2025-11-14 | 13F | Peak6 Llc | 0 | -100,00 | 0 | |||||
| 2026-02-13 | 13F | Pinnacle Wealth Planning Services, Inc. | 249 | 33 | ||||||
| 2026-01-09 | 13F | Marshall Financial Group LLC | 0 | -100,00 | 0 | |||||
| 2026-01-21 | 13F | Retirement Investment Advisors, Inc. | 1.573 | 0,00 | 207 | -15,16 | ||||
| 2026-02-13 | 13F | Mariner, LLC | 42.691 | -1,92 | 5.632 | -16,71 | ||||
| 2026-02-13 | 13F | Mufg Securities (canada), Ltd. | 204.028 | -8,81 | 26.931 | -22,47 | ||||
| 2026-01-23 | 13F | Ritholtz Wealth Management | 3.866 | -13,38 | 510 | -26,55 | ||||
| 2026-01-26 | 13F | Asset Dedication, LLC | 183 | 0,00 | 24 | -14,29 | ||||
| 2026-01-20 | 13F | AdvisorNet Financial, Inc | 33 | -2,94 | 4 | -20,00 | ||||
| 2025-10-17 | 13F | Kaydan Wealth Management, Inc. | 0 | -100,00 | 0 | -100,00 | ||||
| 2026-01-14 | 13F | Net Worth Advisory Group | 1.843 | 243 | ||||||
| 2026-02-17 | 13F | Cetera Investment Advisers | 8.481 | -24,37 | 1.120 | -35,67 | ||||
| 2026-01-27 | 13F | Evergreen Capital Management Llc | 5.743 | 1,79 | 757 | -13,58 | ||||
| 2026-02-10 | 13F | Bnp Paribas Arbitrage, Sa | Call | 0 | -100,00 | 0 | -100,00 | |||
| 2026-02-10 | 13F | PCJ Investment Counsel Ltd. | 0 | -100,00 | 0 | |||||
| 2026-02-03 | 13F | K.J. Harrison & Partners Inc | 2.275 | 301 | ||||||
| 2026-02-10 | 13F | Rothschild Investment Llc | 152 | 1,33 | 20 | -13,04 | ||||
| 2026-02-13 | 13F | Kilter Group LLC | 0 | -100,00 | 0 | |||||
| 2026-02-19 | 13F | Invesco Ltd. | 2.476.965 | 9,93 | 326.687 | -6,66 | ||||
| 2026-02-03 | 13F | Ewa, Llc | 0 | -100,00 | 0 | |||||
| 2026-02-06 | 13F | Bristol Gate Capital Partners Inc. | 3.994 | -23,55 | 528 | -35,02 | ||||
| 2026-02-13 | 13F | Barclays Plc | Call | 0 | -100,00 | 0 | -100,00 | |||
| 2026-02-12 | 13F | APG Asset Management N.V. | 136.771 | 37,18 | 15.388 | 16,77 | ||||
| 2026-02-17 | 13F | Point72 Asset Management, L.P. | 0 | -100,00 | 0 | -100,00 | ||||
| 2026-02-12 | 13F | UniSuper Management Pty Ltd | 2.700 | 0,00 | 489 | -16,12 | ||||
| 2026-02-13 | 13F | Stifel Financial Corp | 136.290 | 24,82 | 17.976 | 5,98 | ||||
| 2026-01-22 | 13F | Apollon Wealth Management, LLC | 8.275 | -6,83 | 1.091 | -20,88 | ||||
| 2026-02-11 | 13F | Ameritas Investment Partners, Inc. | 16.082 | 2.121 | ||||||
| 2026-02-17 | 13F | Worldquant Millennium Advisors Llc | 0 | -100,00 | 0 | |||||
| 2025-11-13 | 13F | Jefferies Financial Group Inc. | 0 | -100,00 | 0 | -100,00 | ||||
| 2026-02-12 | 13F | IFC & Insurance Marketing, Inc. | 37 | 0 | ||||||
| 2026-02-17 | 13F | Westwood Holdings Group Inc | 2.889 | -0,03 | 381 | -15,14 | ||||
| 2026-02-12 | 13F | Quadrant Capital Group Llc | 8.709 | 0,72 | 1.149 | -14,52 | ||||
| 2026-02-13 | 13F | Gen-Wealth Partners Inc | 7 | 0,00 | 1 | -100,00 | ||||
| 2025-10-17 | 13F | Old North State Wealth Management, LLC | 0 | -100,00 | 0 | -100,00 | ||||
| 2026-01-30 | 13F | Wealthfront Advisers Llc | 1.966 | 259 | ||||||
| 2026-02-17 | 13F | Nissay Asset Management Corp /japan/ /adv | 64.094 | 7,36 | 8.453 | -8,84 | ||||
| 2026-02-13 | 13F | Gts Securities Llc | 1.858 | -82,89 | 245 | -85,48 | ||||
| 2026-02-02 | 13F | Intact Investment Management Inc. | 6.300 | -71,93 | 831 | -76,15 | ||||
| 2026-02-03 | 13F | Sequoia Financial Advisors, LLC | 4.997 | -23,77 | 659 | -35,27 | ||||
| 2026-02-10 | 13F | CIBC World Markets Inc. | Call | 4.900 | 647 | |||||
| 2026-02-17 | 13F | Advisor Group Holdings, Inc. | 9.126 | -51,06 | 1.206 | -61,50 | ||||
| 2026-02-10 | 13F | CIBC World Markets Inc. | 966.627 | -9,76 | 127.575 | -23,29 | ||||
| 2025-11-12 | 13F | Kingsview Wealth Management, LLC | 0 | -100,00 | 0 | -100,00 | ||||
| 2026-02-17 | 13F | Wiley Bros.-aintree Capital, Llc | 4.652 | -40,44 | 614 | -49,30 | ||||
| 2025-11-12 | 13F | Burgundy Asset Management Ltd. | 1.593 | 0,00 | 283 | -11,60 | ||||
| 2026-02-24 | 13F | Bell Investment Advisors, Inc | 30 | -9,09 | 4 | -40,00 | ||||
| 2025-11-14 | 13F | Eqis Capital Management, Inc. | 0 | -100,00 | 0 | |||||
| 2026-01-28 | 13F | Gold Investment Management Ltd. | 305 | -9,23 | 40 | -23,08 | ||||
| 2026-02-13 | 13F | SEG Family Corp. | 2.901.405 | -11,57 | 382.666 | -24,92 | ||||
| 2026-01-21 | 13F | Stone House Investment Management, LLC | 0 | -100,00 | 0 | |||||
| 2025-10-30 | 13F | Ridgewood Investments LLC | 0 | -100,00 | 0 | -100,00 | ||||
| 2026-01-27 | 13F | Checchi Capital Advisers, LLC | 4.540 | -8,67 | 599 | -22,41 | ||||
| 2026-02-17 | 13F | Scientech Research LLC | 0 | -100,00 | 0 | |||||
| 2026-02-06 | 13F | Envestnet Portfolio Solutions, Inc. | 0 | -100,00 | 0 | |||||
| 2025-11-14 | 13F | Sora Investors Llc | 0 | -100,00 | 0 | -100,00 | ||||
| 2025-11-05 | 13F | Prasad Wealth Partners, LLC | 0 | -100,00 | 0 | -100,00 | ||||
| 2025-12-15 | 13F/A | Hudson Bay Capital Management LP | 0 | -100,00 | 0 | -100,00 | ||||
| 2026-02-13 | 13F | Evelyn Partners Asset Management Ltd | 23 | 0,00 | 3 | 0,00 | ||||
| 2025-11-14 | 13F | Point72 Hong Kong Ltd | 66.597 | 10.344 | ||||||
| 2026-02-02 | 13F | Fifth Third Bancorp | 349 | 17,91 | 46 | 2,22 | ||||
| 2026-02-12 | 13F | Advisors Asset Management, Inc. | 1.020 | -64,00 | 135 | -69,55 | ||||
| 2026-02-17 | 13F | Clear Street Markets Llc | 678 | 33.800,00 | 89 | |||||
| 2025-11-06 | 13F | Financial Advocates Investment Management | 0 | -100,00 | 0 | -100,00 | ||||
| 2025-12-15 | 13F | CTC Alternative Strategies, Ltd. | 0 | -100,00 | 0 | |||||
| 2026-02-17 | 13F | Caisse De Depot Et Placement Du Quebec | 0 | -100,00 | 0 | |||||
| 2026-04-13 | 13F | Massmutual Trust Co Fsb/adv | 302 | -11,95 | 27 | -40,00 | ||||
| 2026-02-05 | 13F | PAX Financial Group, LLC | 2.752 | -0,97 | 363 | -16,01 | ||||
| 2026-02-11 | 13F | Tacita Capital Inc | 3.736 | -45,03 | 493 | -53,31 | ||||
| 2026-01-09 | 13F | SG Americas Securities, LLC | 137.916 | 1.310,62 | 18 | 1.700,00 | ||||
| 2026-01-21 | 13F | Prime Capital Investment Advisors, LLC | 1.877 | -35,16 | 248 | -44,99 | ||||
| 2026-02-10 | 13F | CIBC Asset Management Inc | 1.607.468 | 17,74 | 212.493 | 0,20 | ||||
| 2026-02-02 | 13F | Capital Investment Counsel, LLC | 47.174 | -0,41 | 6.222 | -15,44 | ||||
| 2025-10-22 | 13F | Geneos Wealth Management Inc. | 0 | -100,00 | 0 | -100,00 | ||||
| 2026-01-20 | 13F | Trust Co Of Toledo Na /oh/ | 381 | 0,00 | 50 | -15,25 | ||||
| 2026-01-09 | 13F | Assenagon Asset Management S.A. | 6.496 | -1,07 | 858 | -15,80 | ||||
| 2026-02-11 | 13F | Harvest Fund Management Co., Ltd | 33.214 | 20,08 | 4 | 0,00 | ||||
| 2026-02-03 | 13F | ASR Vermogensbeheer N.V. | 8.770 | 0,00 | 1.159 | -14,98 | ||||
| 2026-02-17 | 13F | Prelude Capital Management, Llc | 2.395 | 316 | ||||||
| 2026-02-26 | 13F | Anchor Investment Management, LLC | 12 | 0,00 | 2 | 0,00 | ||||
| 2026-04-10 | 13F | Charles Schwab Trust Co | 6.720 | 0,00 | 605 | -31,83 | ||||
| 2026-02-12 | 13F | BRYN MAWR TRUST Co | 24 | 0,00 | 3 | 0,00 | ||||
| 2025-11-06 | 13F | Johnson Investment Counsel Inc | 0 | -100,00 | 0 | -100,00 | ||||
| 2025-10-23 | 13F | Park Avenue Securities Llc | 0 | -100,00 | 0 | |||||
| 2026-02-17 | 13F | Royal Bank Of Canada | Put | 30.000 | 3.957 | |||||
| 2026-02-17 | 13F | Royal Bank Of Canada | 9.784.789 | -4,21 | 1.290.517 | -18,67 | ||||
| 2025-11-14 | 13F | EFG Asset Management (Americas) Corp. | 11.865 | -8,82 | 1.843 | -29,61 | ||||
| 2026-01-23 | 13F | Lester Murray Antman dba SimplyRich | 7.018 | -0,79 | 1 | -100,00 | ||||
| 2026-02-17 | 13F | Gotham Asset Management, LLC | 26.394 | 23,82 | 3.481 | 5,13 | ||||
| 2026-02-10 | 13F | Godfrey Financial Associates, Inc. | 16 | 2 | ||||||
| 2026-02-17 | 13F | Magnetar Financial LLC | 0 | -100,00 | 0 | |||||
| 2025-11-04 | 13F | Landaas & Co /wi /adv | 0 | -100,00 | 0 | -100,00 | ||||
| 2026-01-27 | 13F | Zurcher Kantonalbank (Zurich Cantonalbank) | 185.423 | 340,92 | 24.502 | 275,15 | ||||
| 2026-02-17 | 13F | Qube Research & Technologies Ltd | 13.758 | -93,37 | 1.816 | -94,37 | ||||
| 2026-02-12 | 13F | Bank Of Nova Scotia Trust Co | 45.505 | -12,13 | 6.002 | -25,40 | ||||
| 2026-02-12 | 13F | Swiss National Bank | 416.655 | -8,16 | 55.097 | -21,82 | ||||
| 2025-11-05 | 13F | HORAN Wealth, LLC | 0 | -100,00 | 0 | -100,00 | ||||
| 2026-02-04 | 13F | Abc Arbitrage Sa | 0 | -100,00 | 0 | |||||
| 2026-04-10 | 13F | Armstrong Advisory Group, Inc | 4 | 0,00 | 0 | |||||
| 2026-02-03 | 13F | Bokf, Na | 0 | -100,00 | 0 |