Basisstatistiken
| Institutionelle Aktien (Long) | 305.048.973 - 52,48% (ex 13D/G) - change of -59,81MM shares -16,39% MRQ |
| Institutioneller Wert (Long) | $ 11.542.627 USD ($1000) |
Institutioneller Eigentümerschaft und Aktionäre
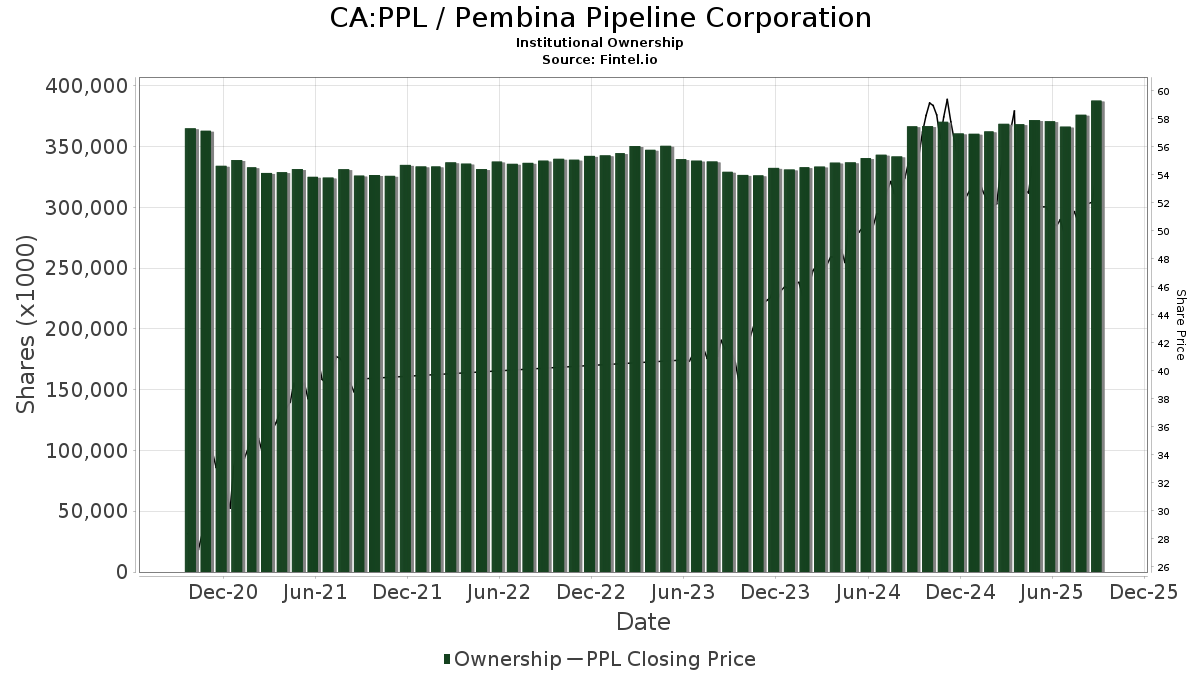
Pembina Pipeline Corporation (CA:PPL) hat 402 institutionelle Eigentümer und Aktionäre, die 13D/G oder 13F Formulare bei der Securities Exchange Commission (SEC) eingereicht haben. Diese Institutionen halten insgesamt 305,048,973 Aktien. Die größten Aktionäre sind Royal Bank Of Canada, Vanguard Group Inc, Bank Of Montreal /can/, FIL Ltd, 1832 Asset Management L.P., Mackenzie Financial Corp, CIBC World Markets Inc., CIBC Asset Management Inc, Scotia Capital Inc., and Td Asset Management Inc .
Pembina Pipeline Corporation (TSX:PPL) Die institutionelle Eigentümerstruktur zeigt die aktuellen Positionen von Institutionen und Fonds im Unternehmen sowie die jüngsten Veränderungen der Positionsgröße. Zu den Großaktionären können Einzelanleger, Investmentfonds, Hedgefonds oder Institutionen gehören. Der Schedule 13D zeigt an, dass der Investor mehr als 5% des Unternehmens hält (oder gehalten hat) und beabsichtigt (oder beabsichtigt hat), aktiv eine Änderung der Geschäftsstrategie zu verfolgen. Schedule 13G zeigt eine passive Investition von über 5% an.
The share price as of April 21, 2026 is 58,03 / share. Previously, on April 24, 2025, the share price was 53,16 / share. This represents an increase of 9,16% over that period.
Fondsstimmung-Score
Der Fondsstimmung-Score (auch bekannt als Eigentümer-Akkumulations-Score) ermittelt die Aktien, die am meisten von Fonds gekauft werden. Er ist das Ergebnis eines ausgeklügelten quantitativen Multifaktormodells, das die Unternehmen mit den höchsten institutionellen Käufen identifiziert. Das Scoring-Modell verwendet eine Kombination aus der Gesamtzunahme der offengelegten Eigentümer, den Änderungen der Portfolioallokationen in diesen Eigentümern und anderen Metriken. Die Zahl reicht von 0 bis 100, wobei höhere Zahlen ein höheres Maß an Kapitalakkumulation als bei anderen Unternehmen anzeigen und 50 den Durchschnitt darstellt.
Aktualisierungshäufigkeit: Täglich
Siehe Ownership Explorer, der eine Liste der am höchsten bewerteten Unternehmen enthält.
AI+ Ask Fintel’s AI assistant about Pembina Pipeline Corporation.
Select a question to share a public post with an AI-crafted answer.
Thinking of good questions…
13F und NPORT Einreichungen
Details zu 13F-Einreichungen sind kostenlos. Für Details zu NP-Einreichungen ist eine Premium-Mitgliedschaft erforderlich. Grüne Zeilen zeigen neue Positionen an. Rote Zeilen zeigen geschlossene Positionen an. Klicken Sie auf das Link Symbol, um den gesamten Transaktionsverlauf zu sehen.
Upgrade
um Prämiendaten freizuschalten und nach Excel zu exportieren ![]() .
.
| Datei Datum | Quelle | Anleger | Typ | Durchschnittlicher Preis (Est) |
Aktien | Δ Aktien (%) |
Gemeldeter Wert ($1000) |
Δ Wert (%) |
Port Alloc (%) |
|
|---|---|---|---|---|---|---|---|---|---|---|
| 2026-04-15 | 13F | Addenda Capital Inc. | 605.547 | -2,17 | 37.707 | 16,51 | ||||
| 2026-02-13 | 13F | Ieq Capital, Llc | 19.068 | 114,15 | 726 | 101,39 | ||||
| 2026-01-28 | 13F | DekaBank Deutsche Girozentrale | 2.187.064 | 0,00 | 86 | -1,15 | ||||
| 2026-04-15 | 13F | Exchange Traded Concepts, Llc | 2.324 | -6,44 | 104 | 10,64 | ||||
| 2026-02-04 | 13F | Heronetta Management, L.P. | 197.698 | 0,00 | 10.086 | -7,00 | ||||
| 2025-11-14 | 13F | ICONIQ Capital, LLC | 0 | -100,00 | 0 | |||||
| 2026-01-21 | 13F | Stock Yards Bank & Trust Co | 8.270 | 0,00 | 315 | -5,99 | ||||
| 2026-02-13 | 13F | Ontario Teachers Pension Plan Board | 0 | -100,00 | 0 | |||||
| 2026-03-20 | 13F | Purpose Unlimited Inc. | 582.753 | 22.201 | ||||||
| 2026-04-14 | 13F | Nbc Securities, Inc. | 4.639 | -10,65 | 208 | 5,08 | ||||
| 2026-04-20 | 13F | Hilton Head Capital Partners, LLC | 2.939 | -44,96 | 132 | -35,47 | ||||
| 2026-01-26 | 13F | Duff & Phelps Investment Management Co | 963.076 | -0,33 | 36.735 | -6,00 | ||||
| 2026-04-13 | 13F | Chickasaw Capital Management Llc | 22.000 | -8,33 | 1 | |||||
| 2026-02-17 | 13F | SIG North Trading, ULC | 705.432 | 4,45 | 26.849 | -1,75 | ||||
| 2026-02-17 | 13F | SIG North Trading, ULC | Put | 2.060.300 | -12,22 | 78.415 | -17,43 | |||
| 2026-02-04 | 13F | Hallmark Capital Management Inc | 212 | 0,00 | 8 | 0,00 | ||||
| 2026-04-17 | 13F | Tectonic Advisors Llc | 49.283 | 7,59 | 2.206 | 26,51 | ||||
| 2026-02-17 | 13F | SIG North Trading, ULC | Call | 307.000 | -52,21 | 11.684 | -55,05 | |||
| 2026-02-06 | 13F | Addison Advisors LLC | 32 | 1 | ||||||
| 2026-02-13 | 13F | Golden State Wealth Management, LLC | 1.000 | 0,00 | 38 | -5,00 | ||||
| 2026-02-13 | 13F | USS Investment Management Ltd | 110.640 | 0,00 | 4.222 | -5,63 | ||||
| 2026-02-17 | 13F | Optiver Holding B.V. | 2 | 0 | ||||||
| 2026-01-30 | 13F | North Star Investment Management Corp. | 0 | -100,00 | 0 | |||||
| 2026-02-17 | 13F | Cresset Asset Management, LLC | 13.575 | -0,26 | 517 | -6,18 | ||||
| 2026-02-11 | 13F | Capital World Investors | 50.709 | -20,30 | 1.932 | -24,92 | ||||
| 2026-03-06 | 13F | Hsbc Holdings Plc | 0 | -100,00 | 0 | |||||
| 2025-11-14 | 13F | Gluskin Sheff & Assoc Inc | 0 | -100,00 | 0 | |||||
| 2026-02-09 | 13F | Huntington National Bank | 7.567 | 0,00 | 288 | -5,88 | ||||
| 2026-02-13 | 13F | Recurrent Investment Advisors LLC | 1.490.143 | -12,30 | 56.951 | -17,47 | ||||
| 2026-04-22 | 13F | Janney Montgomery Scott LLC | 13.916 | -10,66 | 1 | |||||
| 2026-02-17 | 13F | State Of Wisconsin Investment Board | 203.499 | 7.763 | ||||||
| 2025-11-07 | 13F | Sierra Ocean, Llc | 0 | -100,00 | 0 | -100,00 | ||||
| 2026-04-13 | 13F | JCIC Asset Management Inc. | 6.322 | 1,85 | 282 | 19,49 | ||||
| 2026-01-23 | 13F | Smith, Moore & Co. | 7.708 | 0,00 | 293 | -5,79 | ||||
| 2026-02-17 | 13F | Brevan Howard Capital Management LP | 0 | -100,00 | 0 | |||||
| 2026-04-07 | 13F | Cardinal Capital Management, Inc. | 3.555.001 | 8,57 | 158.634 | -7,35 | ||||
| 2026-04-22 | 13F | Summerhill Capital Management lnc. | 13.662 | 610 | ||||||
| 2026-02-06 | 13F | Global Retirement Partners, LLC | 1.028 | 11,98 | 39 | 5,41 | ||||
| 2026-02-11 | 13F | CLARET ASSET MANAGEMENT Corp | 31.192 | -0,07 | 1 | 0,00 | ||||
| 2026-02-06 | 13F | Harvest Portfolios Group Inc. | 396.916 | 2,65 | 15.121 | -3,28 | ||||
| 2025-11-14 | 13F | Trexquant Investment LP | 0 | -100,00 | 0 | |||||
| 2026-02-09 | 13F | Nicola Wealth Management Ltd. | 987.800 | 28,04 | 37.638 | 20,65 | ||||
| 2026-02-17 | 13F | Public Employees Retirement System Of Ohio | 39.833 | 2,48 | 1.521 | -3,31 | ||||
| 2026-01-22 | 13F | Massachusetts Financial Services Co /ma/ | 762.770 | -0,52 | 29.031 | -6,42 | ||||
| 2026-04-22 | 13F | Wernau Asset Management Inc. | 5.572 | 0,00 | 249 | 17,45 | ||||
| 2026-01-14 | 13F/A | TABR Capital Management, LLC | 80.306 | 3.056 | ||||||
| 2026-02-05 | 13F | Bank Julius Baer & Co. Ltd, Zurich | 2.886 | 0,28 | 110 | -6,03 | ||||
| 2026-02-17 | 13F | Glenmede Trust Co Na | 0 | -100,00 | 0 | |||||
| 2026-02-10 | 13F/A | Northwestern Mutual Wealth Management Co | 13.463 | 4,38 | 512 | -1,73 | ||||
| 2026-01-21 | 13F | Greenleaf Trust | 9.641 | 2,42 | 367 | -3,68 | ||||
| 2026-02-17 | 13F | Citadel Advisors Llc | 7.158 | -87,44 | 272 | -88,20 | ||||
| 2026-02-17 | 13F | Citadel Advisors Llc | Put | 10.200 | 78,95 | 388 | 68,70 | |||
| 2026-02-17 | 13F | Citadel Advisors Llc | Call | 146.300 | 124,04 | 5.568 | 110,75 | |||
| 2026-02-18 | 13F | Beacon Pointe Advisors, LLC | 8.259 | 314 | ||||||
| 2026-01-29 | 13F | Montrusco Bolton Investments Inc. | 229.490 | -17,82 | 8.754 | -22,48 | ||||
| 2026-04-22 | 13F | Pictet Asset Management Holding SA | 252.256 | 0,86 | 11.256 | 17,98 | ||||
| 2026-01-28 | 13F | Eagle Global Advisors Llc | 73.730 | -16,60 | 2.806 | -21,53 | ||||
| 2026-04-15 | 13F | Albert D Mason Inc | 40.098 | 0,75 | 1.795 | 18,49 | ||||
| 2026-02-12 | 13F | Bank Of Montreal /can/ | Put | 0 | -100,00 | 0 | -100,00 | |||
| 2026-01-20 | 13F | Cromwell Holdings LLC | 1.739 | 0,00 | 66 | -5,71 | ||||
| 2026-02-11 | 13F | Group One Trading, L.p. | Call | 16.000 | -87,94 | 609 | -88,68 | |||
| 2026-02-11 | 13F | Group One Trading, L.p. | Put | 200 | -97,06 | 8 | -97,45 | |||
| 2026-02-11 | 13F | Group One Trading, L.p. | 299 | 11 | ||||||
| 2025-11-14 | 13F | Wolverine Trading, Llc | Call | 9.400 | 376 | |||||
| 2026-02-17 | 13F | Cetera Investment Advisers | 72.917 | -0,11 | 2.775 | -6,03 | ||||
| 2026-02-17 | 13F | Millennium Management Llc | Call | 0 | -100,00 | 0 | ||||
| 2026-04-21 | 13F | GHP Investment Advisors, Inc. | 518 | 0,00 | 23 | 21,05 | ||||
| 2026-02-13 | 13F | Rhumbline Advisers | 4.172 | -6,60 | 159 | -12,22 | ||||
| 2026-02-02 | 13F | Montag A & Associates Inc | 11.575 | 0,00 | 441 | -5,98 | ||||
| 2026-02-13 | 13F | Mosaic Financial Group, Llc | 6.750 | 0,00 | 0 | |||||
| 2026-02-10 | 13F | Texas Yale Capital Corp. | 10.247 | 0,00 | 390 | -5,80 | ||||
| 2026-02-11 | 13F | Parallel Advisors, LLC | 1.446 | 43,31 | 55 | 37,50 | ||||
| 2026-02-17 | 13F/A | Northwest & Ethical Investments L.P. | 275.611 | 19,53 | 10.500 | 12,61 | ||||
| 2026-01-27 | 13F | Jackson, Grant Investment Advisers, Inc. | 450 | 0,00 | 17 | -5,56 | ||||
| 2026-02-11 | 13F | Prudential Plc | 0 | -100,00 | 0 | |||||
| 2026-02-17 | 13F | Guardian Partners Inc. | 269.137 | 8,76 | 11.315 | 14,27 | ||||
| 2026-02-13 | 13F | Korea Investment CORP | 317.756 | 5,78 | 12.121 | -0,22 | ||||
| 2026-02-17 | 13F | Susquehanna International Group, Llp | Put | 0 | -100,00 | 0 | ||||
| 2026-04-17 | 13F | CENTRAL TRUST Co | 515 | 0,00 | 23 | 21,05 | ||||
| 2026-02-13 | 13F | Marshall Wace, Llp | 0 | -100,00 | 0 | |||||
| 2025-11-14 | 13F | AXA Investment Managers S.A. | 30.168 | 1.221 | ||||||
| 2026-02-10 | 13F | Catalyst Capital Advisors LLC | 399.887 | -10,15 | 15.220 | -15,48 | ||||
| 2026-01-27 | 13F | First Horizon Corp | 97 | 0,00 | 4 | 0,00 | ||||
| 2026-02-13 | 13F | Charles Schwab Investment Management Inc | 1.755.701 | 3,99 | 66.975 | -1,91 | ||||
| 2026-04-09 | 13F | Pacifica Partners Inc. | 13.276 | -1,19 | 593 | 14,92 | ||||
| 2026-04-20 | 13F | William B. Walkup & Associates, Inc. | 2.975 | 0,00 | 119 | 5,31 | ||||
| 2026-02-11 | 13F | Allianz Asset Management GmbH | 42.692 | -31,85 | 1.629 | -35,73 | ||||
| 2026-02-17 | 13F | Qube Research & Technologies Ltd | 46.240 | -78,02 | 1.762 | -79,30 | ||||
| 2026-02-13 | 13F | Walleye Capital LLC | 0 | -100,00 | 0 | |||||
| 2026-02-13 | 13F | 1832 Asset Management L.P. | 11.767.638 | 591,76 | 447.876 | 550,73 | ||||
| 2026-04-13 | 13F | Mather Group, Llc. | 817 | 37 | ||||||
| 2026-02-13 | 13F | Alberta Investment Management Corp | 454.500 | 0,00 | 17.315 | -5,75 | ||||
| 2026-02-09 | 13F | Mediolanum International Funds Ltd | 16.820 | 7,77 | 643 | 3,04 | ||||
| 2026-02-17 | 13F | Two Sigma Investments, Lp | 74.479 | -37,45 | 2.835 | -41,17 | ||||
| 2026-02-12 | 13F | BlackRock, Inc. | 711.090 | 5,13 | 27.064 | -1,10 | ||||
| 2026-04-21 | 13F | PDS Planning, Inc | 4.935 | 221 | ||||||
| 2026-02-13 | 13F | Natixis | 75.234 | 12,37 | 2.863 | 5,72 | ||||
| 2026-02-17 | 13F | Bank Of America Corp /de/ | Put | 0 | -100,00 | 0 | ||||
| 2026-02-04 | 13F | MONECO Advisors, LLC | 6.221 | 1,15 | 237 | -4,84 | ||||
| 2026-02-06 | 13F | GPS Wealth Strategies Group, LLC | 0 | -100,00 | 0 | |||||
| 2026-02-17 | 13F | Safe Harbor Fiduciary, LLC | 619 | 0,00 | 24 | 0,00 | ||||
| 2026-04-22 | 13F | Viewpoint Investment Partners Corp | 9.800 | 443 | ||||||
| 2026-01-21 | 13F | Sound Income Strategies, LLC | 692 | 0,00 | 27 | -3,70 | ||||
| 2026-02-17 | 13F | Creative Planning | 108.014 | 13,84 | 4.111 | 7,11 | ||||
| 2026-02-17 | 13F | Susquehanna International Group, Llp | 0 | -100,00 | 0 | |||||
| 2026-02-13 | 13F | Royal London Asset Management Ltd | 25.403 | -11,37 | 967 | -16,65 | ||||
| 2026-04-24 | 13F | Tcfg Wealth Management, Llc | 10.975 | 0,19 | 491 | 18,03 | ||||
| 2026-02-09 | 13F | Harbour Investments, Inc. | 1.475 | -19,66 | 56 | -24,32 | ||||
| 2026-02-06 | 13F | HighTower Advisors, LLC | 24.687 | 13,48 | 940 | 6,70 | ||||
| 2026-01-29 | 13F | UMA Financial Services, Inc. | 920 | 0,00 | 35 | -5,41 | ||||
| 2026-02-12 | 13F | Steward Partners Investment Advisory, Llc | 52.669 | 24,53 | 2.005 | 17,12 | ||||
| 2026-02-17 | 13F | Sciencast Management LP | 19.365 | 737 | ||||||
| 2026-02-13 | 13F | Lord, Abbett & Co. Llc | 149.337 | -7,78 | 6 | -16,67 | ||||
| 2026-02-11 | 13F | Clearbridge Investments, LLC | 1.635.257 | -2,91 | 62.238 | -8,67 | ||||
| 2026-02-13 | 13F | Morgan Dempsey Capital Management Llc | Call | 0 | -100,00 | 0 | -100,00 | |||
| 2026-02-13 | 13F | Van Eck Associates Corp | 294.551 | 6,74 | 11 | 0,00 | ||||
| 2026-02-17 | 13F | SageView Advisory Group, LLC | 34 | 1 | ||||||
| 2026-03-02 | 13F | Tobam | 741 | 0 | ||||||
| 2026-01-23 | 13F | Westside Investment Management, Inc. | 808 | 0,00 | 31 | -3,12 | ||||
| 2026-02-10 | 13F | IAG Wealth Partners, LLC | 200 | 0,00 | 8 | -12,50 | ||||
| 2026-03-18 | 13F | Employees Provident Fund Board | 0 | -100,00 | 0 | |||||
| 2026-02-13 | 13F | Caitong International Asset Management Co., Ltd | 0 | -100,00 | 0 | |||||
| 2026-02-17 | 13F | Laird Norton Trust Company, Llc | 12.441 | 474 | ||||||
| 2026-04-17 | 13F | Bell Investment Advisors, Inc | 141 | 0,00 | 6 | 20,00 | ||||
| 2026-02-13 | 13F | SRS Capital Advisors, Inc. | 3.248 | -2,37 | 124 | -8,21 | ||||
| 2026-02-02 | 13F | Millstone Evans Group, LLC | 2.500 | 0,00 | 95 | -5,94 | ||||
| 2026-04-09 | 13F | Thrive Wealth Management, LLC | 23.421 | -10,48 | 1.048 | 5,33 | ||||
| 2026-02-12 | 13F | Brown Brothers Harriman & Co | 9.768 | 3,62 | 372 | -2,62 | ||||
| 2026-02-13 | 13F | Colony Group, LLC | 21.158 | 230,08 | 817 | 215,06 | ||||
| 2026-02-17 | 13F | DZ BANK AG Deutsche Zentral Genossenschafts Bank, Frankfurt am Main | 271.991 | 0,00 | 10.352 | -5,91 | ||||
| 2026-02-11 | 13F | Metis Global Partners, LLC | 72.950 | -0,38 | 2.779 | -6,11 | ||||
| 2026-04-06 | 13F | Miller Global Investments, LLC | 6.576 | -0,63 | 294 | 17,13 | ||||
| 2026-02-11 | 13F | Fiera Capital Corp | 957.322 | -10,85 | 36.511 | -15,88 | ||||
| 2026-02-17 | 13F | Susquehanna International Group, Llp | Call | 79.700 | 104,88 | 3.033 | 92,82 | |||
| 2026-02-12 | 13F | Campbell & CO Investment Adviser LLC | 0 | -100,00 | 0 | |||||
| 2026-04-06 | 13F | Versant Capital Management, Inc | 1.691 | -6,93 | 76 | 8,70 | ||||
| 2026-02-13 | 13F | Beutel, Goodman & Co Ltd. | 238.706 | -1,30 | 9 | 0,00 | ||||
| 2026-02-05 | 13F | Allworth Financial LP | 3.272 | 0,46 | 125 | -5,34 | ||||
| 2026-02-13 | 13F | Stifel Financial Corp | 30.600 | 8,23 | 1.165 | 1,84 | ||||
| 2026-04-21 | 13F | Financial Consulate, Inc | 440 | 3,53 | 20 | 18,75 | ||||
| 2026-02-17 | 13F | Advisory Services Network, LLC | 0 | -100,00 | 0 | |||||
| 2026-02-13 | 13F | National Bank Of Canada /fi/ | Put | 2.611 | 64,52 | 9.946 | 54,99 | |||
| 2026-02-13 | 13F | Kayne Anderson Capital Advisors Lp | 1.765.768 | -0,12 | 67.205 | -6,04 | ||||
| 2025-12-02 | 13F | Allworth Financial LP | Call | 4 | ||||||
| 2026-01-29 | 13F | Dunhill Financial, LLC | 675 | 0,00 | 26 | -7,41 | ||||
| 2026-02-09 | 13F | Prospera Financial Services Inc | 0 | -100,00 | 0 | |||||
| 2026-02-12 | 13F | Renaissance Technologies Llc | 27.564 | -88,33 | 1.049 | -89,02 | ||||
| 2026-02-17 | 13F | Investment Management Corp of Ontario | 144.949 | 52,32 | 5.517 | 43,27 | ||||
| 2026-02-10 | 13F | Edgemoor Investment Advisors, Inc. | 86.490 | -0,87 | 3.292 | -6,77 | ||||
| 2026-02-10 | 13F | CIBC Asset Management Inc | 8.620.307 | 17,83 | 329.245 | 11,19 | ||||
| 2026-02-13 | 13F | National Bank Of Canada /fi/ | Call | 9.305 | 131,99 | 35.446 | 118,55 | |||
| 2026-02-13 | 13F | Manufacturers Life Insurance Company, The | 0 | -100,00 | 0 | |||||
| 2026-02-13 | 13F | Arrowstreet Capital, Limited Partnership | 0 | -100,00 | 0 | |||||
| 2026-02-13 | 13F | Broderick Brian C | 32.523 | 0,00 | 1.238 | -5,93 | ||||
| 2026-02-11 | 13F | Empowered Funds, LLC | 24.449 | 1,02 | 931 | -5,01 | ||||
| 2026-02-06 | 13F | Cullen/frost Bankers, Inc. | 898 | 0,00 | 34 | -5,56 | ||||
| 2026-02-05 | 13F | Bessemer Group Inc | 13.008 | -12,81 | 0 | |||||
| 2026-02-17 | 13F | Gotham Asset Management, LLC | 26.155 | 50,24 | 995 | 41,34 | ||||
| 2026-02-13 | 13F | Pinnacle Wealth Planning Services, Inc. | 882 | 34 | ||||||
| 2026-02-09 | 13F | Delta Asset Management Llc/tn | 200 | 0,00 | 8 | -12,50 | ||||
| 2026-01-26 | 13F | Cwm, Llc | 5.281 | -0,25 | 0 | |||||
| 2026-02-12 | 13F | Aviva Plc | 473.702 | 2,67 | 18.061 | -3,09 | ||||
| 2026-02-09 | 13F | Kingsview Wealth Management, LLC | 5.353 | -24,48 | 204 | -29,02 | ||||
| 2026-02-10 | 13F | Nomura Asset Management Co Ltd | 0 | 0 | ||||||
| 2026-02-10 | 13F | Connor, Clark & Lunn Investment Management Ltd. | 789.056 | -64,97 | 30.058 | -66,99 | ||||
| 2026-02-18 | 13F | Guardian Capital Lp | 446.491 | -1,02 | 17.031 | -6,64 | ||||
| 2026-02-09 | 13F | Geode Capital Management, Llc | 5.781.068 | 7,14 | 224.837 | 1,24 | ||||
| 2026-02-17 | 13F | IHT Wealth Management, LLC | 5.572 | 0,29 | 212 | -5,36 | ||||
| 2026-02-17 | 13F | Tower Research Capital LLC (TRC) | 6.348 | -80,63 | 242 | -81,81 | ||||
| 2026-02-04 | 13F | HighPoint Advisor Group LLC | 12.362 | -12,31 | 471 | -17,54 | ||||
| 2026-03-24 | 13F | Old North State Trust, LLC | 5.790 | 0,00 | 0 | |||||
| 2025-11-12 | 13F | Erste Asset Management GmbH | 12.000 | 210,24 | 481 | 78,44 | ||||
| 2025-11-14 | 13F | Brookfield Asset Management Inc. | 0 | -100,00 | 0 | -100,00 | ||||
| 2026-04-22 | 13F | Spire Wealth Management | 557 | 0,54 | 25 | 14,29 | ||||
| 2026-02-02 | 13F | Danske Bank A/s | 15.526 | 592 | ||||||
| 2026-02-17 | 13F | SummitTX Capital, L.P. | 15.061 | 45,07 | 573 | 36,43 | ||||
| 2026-02-17 | 13F | Advisor Group Holdings, Inc. | 40.835 | 54,88 | 1.555 | 53,41 | ||||
| 2026-04-09 | 13F | Diversified Management Inc | 17.465 | 782 | ||||||
| 2026-02-02 | 13F | Cornerstone Planning Group LLC | 152 | 83,13 | 6 | 500,00 | ||||
| 2026-02-11 | 13F | Letko, Brosseau & Associates Inc | 23.250 | 58,70 | 887 | 49,66 | ||||
| 2026-02-04 | 13F | Swiss Life Asset Management Ltd | 80.744 | 10,19 | 3.075 | 3,64 | ||||
| 2026-02-05 | 13F | Td Private Client Wealth Llc | 6 | 0 | ||||||
| 2026-02-10 | 13F | Periscope Capital Inc. | Call | 792.600 | 30.201 | |||||
| 2026-02-13 | 13F | Police & Firemen's Retirement System of New Jersey | 78.077 | -7,09 | 2.978 | -12,36 | ||||
| 2026-02-17 | 13F | Two Sigma Advisers, Lp | 0 | -100,00 | 0 | -100,00 | ||||
| 2026-02-10 | 13F | Godfrey Financial Associates, Inc. | 5 | 0 | ||||||
| 2026-02-13 | 13F | Bank Of Nova Scotia | 4.064.371 | 17,43 | 154.835 | 10,64 | ||||
| 2026-02-13 | 13F | Macquarie Group Ltd | 0 | -100,00 | 0 | -100,00 | ||||
| 2026-04-24 | 13F | Medallion Wealth Advisors, LLC | 600 | 0,00 | 27 | 18,18 | ||||
| 2026-04-20 | 13F | Ronald Blue Trust, Inc. | 0 | -100,00 | 0 | |||||
| 2025-11-04 | 13F | Guerra Advisors Inc | 7 | 0 | ||||||
| 2026-04-13 | 13F | IFP Advisors, Inc | 1.015 | -15,35 | 45 | 0,00 | ||||
| 2026-02-17 | 13F | Wiley Bros.-aintree Capital, Llc | 11.373 | -1,19 | 433 | -7,10 | ||||
| 2025-11-13 | 13F | Glenmede Investment Management, LP | 0 | -100,00 | 0 | -100,00 | ||||
| 2026-02-17 | 13F | Schonfeld Strategic Advisors LLC | 0 | -100,00 | 0 | |||||
| 2026-02-12 | 13F | Federation des caisses Desjardins du Quebec | 1.517.153 | -9,35 | 57.745 | -14,36 | ||||
| 2026-04-22 | 13F | Continuum Advisory, LLC | 6.207 | -4,55 | 278 | 12,15 | ||||
| 2026-02-03 | 13F | Rnc Capital Management Llc | 24.542 | 1,71 | 934 | -4,30 | ||||
| 2026-02-11 | 13F | Vise Technologies, Inc. | 0 | -100,00 | 0 | |||||
| 2026-01-27 | 13F | Cushing Asset Management, Lp | 1.347.100 | -13,96 | 51.271 | -19,06 | ||||
| 2026-02-13 | 13F | Kayne Anderson Rudnick Investment Management Llc | 647 | 0,00 | 25 | -7,69 | ||||
| 2025-11-14 | 13F | Balyasny Asset Management Llc | 0 | -100,00 | 0 | -100,00 | ||||
| 2026-02-04 | 13F | Marco Investment Management Llc | 5.570 | 0,00 | 212 | -6,22 | ||||
| 2026-02-17 | 13F | Wellington Management Group Llp | 92.258 | -79,98 | 3.519 | -81,11 | ||||
| 2025-11-14 | 13F | Capstone Investment Advisors, Llc | 0 | -100,00 | 0 | |||||
| 2026-02-05 | 13F | Atria Investments Llc | 25.065 | -8,54 | 954 | -13,99 | ||||
| 2026-01-22 | 13F | Bartlett & Co. Wealth Management Llc | 400 | 0,00 | 15 | -6,25 | ||||
| 2026-04-13 | 13F | Massmutual Trust Co Fsb/adv | 3.100 | -3,43 | 139 | 13,11 | ||||
| 2025-11-14 | 13F | Wetherby Asset Management Inc | 6.298 | -5,38 | 255 | 2,01 | ||||
| 2026-02-02 | 13F | Fifth Third Bancorp | 606 | 180,56 | 23 | 187,50 | ||||
| 2025-11-07 | 13F | Shell Asset Management Co | 22.118 | -35,44 | 1 | -100,00 | ||||
| 2026-02-12 | 13F | JPL Wealth Management, LLC | 0 | -100,00 | 0 | |||||
| 2026-01-27 | 13F | Zurcher Kantonalbank (Zurich Cantonalbank) | 149.271 | 0,45 | 5.694 | -5,24 | ||||
| 2025-11-13 | 13F | Acadian Asset Management Llc | 0 | -100,00 | 0 | -100,00 | ||||
| 2026-02-12 | 13F | Wealthspire Advisors, LLC | 0 | -100,00 | 0 | |||||
| 2026-04-20 | 13F | Miller Howard Investments Inc /ny | 567.713 | 8,73 | 25.411 | 27,87 | ||||
| 2026-02-13 | 13F | Baird Financial Group, Inc. | 61.329 | 0,00 | 2.334 | -5,93 | ||||
| 2026-02-12 | 13F | Triumph Capital Management | 488 | 19 | ||||||
| 2026-02-13 | 13F | Towarzystwo Funduszy Inwestycyjnych Pzu Sa | 0 | -100,00 | 0 | |||||
| 2026-02-17 | 13F | Ameriprise Financial Inc | 31.281 | -0,32 | 1.216 | -6,32 | ||||
| 2026-02-10 | 13F | Bank of New York Mellon Corp | 510.126 | -2,48 | 19.415 | -8,27 | ||||
| 2025-11-14 | 13F | Mount Yale Investment Advisors, LLC | 0 | -100,00 | 0 | |||||
| 2026-04-22 | 13F | Gold Investment Management Ltd. | 11.044 | 0,03 | 494 | 17,38 | ||||
| 2026-02-10 | 13F | Natixis Advisors, L.p. | 45.422 | -2,33 | 2 | 0,00 | ||||
| 2026-02-10 | 13F | Private Wealth Asset Management, LLC | 1.638 | -1,92 | 62 | -7,46 | ||||
| 2026-01-23 | 13F | Rsm Us Wealth Management Llc | 7.883 | 3,17 | 305 | -1,62 | ||||
| 2026-01-28 | 13F | Davis-rea Ltd. | 117.368 | 4,63 | 4.474 | -1,41 | ||||
| 2026-02-12 | 13F | Swiss National Bank | 1.539.796 | -7,87 | 58.781 | -13,05 | ||||
| 2026-02-17 | 13F | Bank Of America Corp /de/ | Call | 0 | -100,00 | 0 | ||||
| 2025-11-14 | 13F | Axa S.a. | 0 | -100,00 | 0 | |||||
| 2026-02-10 | 13F | PCJ Investment Counsel Ltd. | 140.320 | 9,81 | 5.342 | 3,37 | ||||
| 2026-02-13 | 13F | Candriam Luxembourg S.C.A. | 18.382 | 85,12 | 701 | 74,81 | ||||
| 2026-04-23 | 13F | Farmers & Merchants Trust Co of Chambersburg PA | 2.000 | 0,00 | 0 | |||||
| 2026-01-07 | 13F | Aventura Private Wealth, LLC | 446 | 0,00 | 17 | -11,11 | ||||
| 2025-10-30 | 13F | Twin Peaks Wealth Advisors, LLC | 0 | -100,00 | 0 | |||||
| 2026-02-14 | 13F | Rockefeller Capital Management L.P. | 13.607 | -0,66 | 518 | -6,68 | ||||
| 2026-02-17 | 13F | Graham Capital Management, L.P. | 0 | -100,00 | 0 | |||||
| 2026-02-04 | 13F | Ameritas Advisory Services, LLC | 0 | -100,00 | 0 | -100,00 | ||||
| 2026-02-06 | 13F | ProShare Advisors LLC | 65.789 | 5,05 | 2.506 | -1,03 | ||||
| 2026-02-10 | 13F | Td Asset Management Inc | 6.289.540 | -17,05 | 239.927 | -21,75 | ||||
| 2026-01-26 | 13F | PFG Investments, LLC | 16.107 | 23,90 | 613 | 16,76 | ||||
| 2026-01-29 | 13F | UBS Group AG | 1.330.969 | 17,08 | 50.657 | 10,13 | ||||
| 2026-02-06 | 13F | EverSource Wealth Advisors, LLC | 2.564 | 44,21 | 98 | 36,62 | ||||
| 2025-11-13 | 13F | VSM Wealth Advisory, LLC | 0 | -100,00 | 0 | -100,00 | ||||
| 2026-02-06 | 13F | Midwest Professional Planners, LTD. | 23.598 | 39,99 | 898 | 31,67 | ||||
| 2026-02-18 | 13F | GWM Advisors LLC | 12.669 | 29,95 | 482 | 22,34 | ||||
| 2026-02-17 | 13F | Agf Management Ltd | 2.261.156 | 16,56 | 86.232 | 9,80 | ||||
| 2026-04-23 | 13F | Mayflower Financial Advisors, LLC | 7.492 | 1,93 | 335 | 20,07 | ||||
| 2026-02-13 | 13F | Sienna Gestion | 339.024 | 0,00 | 12.897 | 3,17 | ||||
| 2026-02-13 | 13F | FORA Capital, LLC | 0 | -100,00 | 0 | |||||
| 2026-02-12 | 13F | Summit Financial, LLC | 84.812 | 0,00 | 3.228 | -5,95 | ||||
| 2026-02-13 | 13F | MAI Capital Management | 26.069 | 132,51 | 992 | 118,98 | ||||
| 2026-02-13 | 13F | Cornerstone Financial Management LLC | 95 | 4 | ||||||
| 2026-02-13 | 13F | Dynamic Technology Lab Private Ltd | 6.448 | 245 | ||||||
| 2026-02-19 | 13F | Invesco Ltd. | 2.376.841 | -9,64 | 90.463 | -15,00 | ||||
| 2026-01-23 | 13F | Kellett Schaffner Wealth Advisors LLC | 5.400 | 0,00 | 206 | -5,96 | ||||
| 2026-02-02 | 13F | Varma Mutual Pension Insurance Co | 0 | -100,00 | 0 | |||||
| 2026-02-17 | 13F | BCV Asset Management Inc. | 1.613.568 | 95.258 | ||||||
| 2026-04-16 | 13F | Capital Investment Advisors, LLC | 42.123 | -2,45 | 1.885 | 14,73 | ||||
| 2026-02-13 | 13F | JustInvest LLC | 33.460 | 13,04 | 1.273 | 6,35 | ||||
| 2026-02-13 | 13F | National Bank Of Canada /fi/ | 5.157.259 | 57,66 | 196.148 | 48,84 | ||||
| 2026-02-13 | 13F | Mml Investors Services, Llc | 6.076 | -3,17 | 231 | -8,70 | ||||
| 2026-02-17 | 13F | Jones Financial Companies Lllp | 30.953 | -4,77 | 1.178 | -9,52 | ||||
| 2026-02-12 | 13F | Ensign Peak Advisors, Inc | 26.100 | 0,00 | 996 | -5,69 | ||||
| 2026-02-03 | 13F | K.J. Harrison & Partners Inc | 207.560 | 27,29 | 7.919 | 22,32 | ||||
| 2026-02-09 | 13F | Waratah Capital Advisors Ltd. | 0 | -100,00 | 0 | |||||
| 2026-02-10 | 13F | Bruce G. Allen Investments, LLC | 102 | -14,29 | 4 | -25,00 | ||||
| 2026-02-13 | 13F | BNP Paribas Asset Management Holding S.A. | 46.341 | 2 | ||||||
| 2026-02-17 | 13F | Westwood Holdings Group Inc | 1.565.036 | 3,83 | 59.565 | -2,33 | ||||
| 2026-02-13 | 13F | Mariner, LLC | 44.610 | -2,35 | 1.699 | -8,12 | ||||
| 2026-04-20 | 13F | Cardinal Point Capital Management, ULC | 24.516 | 2,68 | 1.095 | 20,33 | ||||
| 2026-02-17 | 13F | Mercer Global Advisors Inc /adv | 31.484 | -3,76 | 1.198 | -9,45 | ||||
| 2026-04-09 | 13F | Silvia Mccoll Wealth Management, Llc | 7.000 | 0,00 | 313 | 17,67 | ||||
| 2026-02-10 | 13F | Intech Investment Management Llc | 26.727 | -38,64 | 1.020 | -42,14 | ||||
| 2025-11-14 | 13F | Zimmer Partners, LP | 0 | -100,00 | 0 | |||||
| 2026-02-17 | 13F | Snowden Capital Advisors LLC | 18.380 | -14,84 | 700 | -19,93 | ||||
| 2026-01-12 | 13F | Viking Fund Management Llc | 0 | -100,00 | 0 | -100,00 | ||||
| 2026-02-17 | 13F | Blackstone Group Inc | 964.494 | 0,96 | 36.709 | -5,03 | ||||
| 2026-02-17 | 13F | Fmr Llc | 2.362.466 | 5.416,82 | 90.002 | 5.099,42 | ||||
| 2026-01-29 | 13F | Sanctuary Advisors, LLC | 7.963 | 303 | ||||||
| 2026-01-30 | 13F | Us Bancorp \de\ | 11.961 | 4,35 | 455 | -1,73 | ||||
| 2026-02-03 | 13F | SBI Securities Co., Ltd. | 137 | 29,25 | 5 | 25,00 | ||||
| 2026-02-17 | 13F | XTX Topco Ltd | 27.387 | -70,70 | 1.042 | -72,45 | ||||
| 2026-02-17 | 13F | Private Advisor Group, LLC | 5.735 | 1,00 | 218 | -4,80 | ||||
| 2026-02-12 | 13F | UniSuper Management Pty Ltd | 1.500.100 | 71,18 | 78.440 | 59,07 | ||||
| 2026-01-28 | 13F | Geneos Wealth Management Inc. | 1.444 | 0,00 | 55 | -6,90 | ||||
| 2026-02-13 | 13F | Healthcare Of Ontario Pension Plan Trust Fund | 0 | -100,00 | 0 | |||||
| 2026-04-17 | 13F | Vermillion Wealth Management, Inc. | 100 | 0,00 | 4 | 33,33 | ||||
| 2025-11-06 | 13F | Wedbush Securities Inc | 0 | -100,00 | 0 | |||||
| 2026-04-13 | 13F | St Germain D J Co Inc | 1.012 | 0,00 | 45 | 18,42 | ||||
| 2026-02-13 | 13F | Kestra Advisory Services, LLC | 0 | -100,00 | 0 | |||||
| 2026-02-11 | 13F | Westerkirk Capital Inc. | 1.700 | -93,03 | 65 | -93,52 | ||||
| 2026-01-30 | 13F | Lincluden Management Ltd | 894.163 | -3,64 | 47 | 24,32 | ||||
| 2026-02-11 | 13F | Tacita Capital Inc | 51.774 | 0,21 | 1.974 | -5,60 | ||||
| 2026-02-11 | 13F | Jpmorgan Chase & Co | 2.919.947 | -13,22 | 111.133 | -18,36 | ||||
| 2026-02-18 | 13F | State of Tennessee, Treasury Department | 313.508 | -4,27 | 13.099 | -1,09 | ||||
| 2026-04-20 | 13F | Assenagon Asset Management S.A. | 15.252 | 3,10 | 681 | 20,74 | ||||
| 2025-11-13 | 13F | Hartree Partners, LP | 0 | -100,00 | 0 | |||||
| 2026-02-13 | 13F | Quarry LP | 75 | 3 | ||||||
| 2026-02-17 | 13F | Northern Trust Corp | 471.599 | 0,96 | 17.949 | -5,02 | ||||
| 2026-04-15 | 13F | Stanich Group LLC | 4.680 | 209 | ||||||
| 2026-02-13 | 13F | Wells Fargo & Company/mn | 243.725 | 8,07 | 9.276 | 1,67 | ||||
| 2026-02-12 | 13F | Principal Securities, Inc. | 0 | -100,00 | 0 | -100,00 | ||||
| 2026-04-15 | 13F | Valley National Advisers Inc | 283 | 0,00 | 0 | |||||
| 2026-04-24 | 13F | Yousif Capital Management, Llc | 0 | -100,00 | 0 | |||||
| 2026-02-13 | 13F | Great West Life Assurance Co /can/ | 687.045 | -3,78 | 26 | -7,14 | ||||
| 2026-02-05 | 13F | Cambridge Investment Research Advisors, Inc. | 20.304 | 15,63 | 1 | |||||
| 2026-04-20 | 13F | Kestra Private Wealth Services, Llc | 14.216 | 0,13 | 636 | 17,78 | ||||
| 2026-04-10 | 13F | Country Trust Bank | 0 | -100,00 | 0 | -100,00 | ||||
| 2025-11-13 | 13F | HITE Hedge Asset Management LLC | 0 | -100,00 | 0 | |||||
| 2026-04-03 | 13F | Global Wealth Strategies & Associates | 500 | 0,00 | 22 | 15,79 | ||||
| 2026-02-17 | 13F | Clear Street Markets Llc | 1 | 0 | ||||||
| 2026-02-18 | 13F | Garton & Associates Financial Advisors LLC | 350 | 13 | ||||||
| 2026-02-12 | 13F | Brinker Capital Investments, LLC | 0 | -100,00 | 0 | |||||
| 2026-01-26 | 13F | Baxter Bros Inc | 13.200 | -2,94 | 502 | -8,73 | ||||
| 2025-11-10 | 13F | Sigma Planning Corp | 0 | -100,00 | 0 | |||||
| 2026-01-15 | 13F | Nisa Investment Advisors, Llc | 89 | 3 | ||||||
| 2026-01-27 | 13F | Checchi Capital Advisers, LLC | 6.261 | -6,87 | 238 | -12,50 | ||||
| 2026-02-12 | 13F | Jane Street Group, Llc | Call | 14.300 | -21,43 | 544 | -26,09 | |||
| 2026-02-02 | 13F | Principal Financial Group Inc | 83.308 | 10,33 | 3.178 | 4,06 | ||||
| 2026-02-12 | 13F | Jane Street Group, Llc | 92.689 | -75,41 | 3.528 | -76,87 | ||||
| 2026-02-10 | 13F | Norges Bank | 5.609.272 | 213.701 | ||||||
| 2026-01-30 | 13F/A | M&t Bank Corp | 111.253 | 0,54 | 4.234 | -5,41 | ||||
| 2026-02-13 | 13F | Dixon Mitchell Investment Counsel Inc. | 3.851 | 147 | ||||||
| 2026-04-20 | 13F | Jfs Wealth Advisors, Llc | 72 | -59,32 | 3 | -50,00 | ||||
| 2026-02-12 | 13F | Alps Advisors Inc | 29.143 | 30,06 | 1.109 | 22,41 | ||||
| 2026-02-17 | 13F | Maryland State Retirement & Pension System | 664.819 | -5,60 | 25.359 | -10,92 | ||||
| 2026-02-10 | 13F | CIBC World Markets Inc. | Put | 50.000 | 1.905 | |||||
| 2026-02-10 | 13F | CIBC World Markets Inc. | 10.895.629 | 15,07 | 415.123 | 8,46 | ||||
| 2026-02-17 | 13F | Basso Capital Management, L.p. | 5.001 | 0,00 | 190 | -5,94 | ||||
| 2026-02-17 | 13F | Royal Bank Of Canada | Put | 2.520.700 | 9,09 | 95.938 | 2,62 | |||
| 2026-01-22 | 13F | Cascade Investment Group, Inc. | 57.835 | -2,82 | 2.201 | -8,56 | ||||
| 2026-02-17 | 13F | Royal Bank Of Canada | Call | 838.400 | 12,60 | 31.910 | 5,92 | |||
| 2026-04-06 | 13F | CX Institutional | 0 | -100,00 | 0 | |||||
| 2026-02-17 | 13F | Millennium Management Llc | Put | 232.000 | 0,00 | 12.131 | -7,07 | |||
| 2026-04-23 | 13F | Lansforsakringar Fondforvaltning AB (publ) | 135.912 | 0,00 | 6.064 | 16,98 | ||||
| 2026-02-17 | 13F | Millennium Management Llc | 64.397 | -18,67 | 2.451 | -23,51 | ||||
| 2026-02-17 | 13F | Abel Hall, LLC | 0 | -100,00 | 0 | |||||
| 2026-02-18 | 13F | Mackenzie Financial Corp | 10.913.565 | -7,51 | 415.978 | -12,79 | ||||
| 2025-10-30 | 13F | Jennison Associates Llc | 0 | -100,00 | 0 | |||||
| 2025-11-14 | 13F | Skopos Labs, Inc. | 0 | -100,00 | 0 | |||||
| 2026-02-11 | 13F | Syon Capital Llc | 12.118 | 11,13 | 461 | 4,54 | ||||
| 2026-01-27 | 13F | WealthCollab, LLC | 0 | -100,00 | 0 | -100,00 | ||||
| 2026-02-02 | 13F | Truist Financial Corp | 16.595 | 23,48 | 632 | 16,21 | ||||
| 2026-02-17 | 13F | Captrust Financial Advisors | 5.598 | -6,23 | 213 | -11,62 | ||||
| 2026-02-17 | 13F | Royal Bank Of Canada | 42.260.769 | -24,22 | 1.608.444 | -28,71 | ||||
| 2026-02-13 | 13F | PJT Investments Corp. | 261.340 | 1,36 | 9.947 | -4,66 | ||||
| 2025-11-13 | 13F | Prudential Financial Inc | 0 | -100,00 | 0 | -100,00 | ||||
| 2025-11-17 | 13F | FSA Wealth Management LLC | 212 | 0,00 | 9 | 14,29 | ||||
| 2026-02-10 | 13F | Gulf International Bank (UK) Ltd | 27.890 | 0,35 | 1 | 0,00 | ||||
| 2026-02-17 | 13F | Leonteq Securities AG | 0 | -100,00 | 0 | |||||
| 2026-02-04 | 13F | Beverly Hills Private Wealth, LLC | 5.235 | 0,00 | 212 | 0,00 | ||||
| 2026-02-11 | 13F | Franklin Resources Inc | 1.186.479 | 8,76 | 45.202 | 2,50 | ||||
| 2026-02-12 | 13F | Hrt Financial Lp | 25.475 | 110,97 | 1 | |||||
| 2026-02-10 | 13F | Quantbot Technologies LP | 53.924 | -45,01 | 2.052 | -48,27 | ||||
| 2026-02-23 | 13F | Virtu Financial LLC | 0 | -100,00 | 0 | |||||
| 2026-04-14 | 13F | Granite Group Advisors, LLC | 6.048 | -7,72 | 270 | 8,03 | ||||
| 2026-02-17 | 13F | Aqr Capital Management Llc | 273.531 | 1.086,48 | 10.420 | 1.018,03 | ||||
| 2025-11-12 | 13F | Ameriflex Group, Inc. | 0 | -100,00 | 0 | -100,00 | ||||
| 2025-11-21 | 13F | Nebula Research & Development LLC | 0 | -100,00 | 0 | |||||
| 2026-02-03 | 13F | Crossmark Global Holdings, Inc. | 25.158 | -26,18 | 958 | -30,55 | ||||
| 2026-02-05 | 13F/A | Fulcrum Asset Management LLP | 8.566 | 15,26 | 327 | 9,00 | ||||
| 2026-02-11 | 13F | Picton Mahoney Asset Management | 17.629 | -1,12 | 673 | |||||
| 2026-02-17 | 13F | D. E. Shaw & Co., Inc. | 9.900 | -98,75 | 377 | -98,82 | ||||
| 2026-02-17 | 13F | D. E. Shaw & Co., Inc. | Put | 339.900 | 7,43 | 12.951 | 1,26 | |||
| 2026-02-17 | 13F | D. E. Shaw & Co., Inc. | Call | 495.700 | 0,00 | 18.887 | -5,74 | |||
| 2026-02-17 | 13F | Janus Henderson Group Plc | 2.628.564 | 0,00 | 100.395 | -5,57 | ||||
| 2026-01-13 | 13F | CoreCap Advisors, LLC | 0 | -100,00 | 0 | -100,00 | ||||
| 2026-02-05 | 13F | Disciplined Investments, LLC | 0 | -100,00 | 0 | |||||
| 2026-02-03 | 13F | Sequoia Financial Advisors, LLC | 26.583 | -1,65 | 1.012 | -7,50 | ||||
| 2026-02-11 | 13F | BLI - Banque de Luxembourg Investments | 20.800 | -46,67 | 794 | -49,68 | ||||
| 2026-02-12 | 13F | Commonwealth Equity Services, Llc | 194.565 | -7,20 | 7.405 | 92.462,50 | ||||
| 2026-01-27 | 13F | TD Waterhouse Canada Inc. | 1.703.413 | 2,46 | 64.798 | -1,78 | ||||
| 2026-02-13 | 13F | Pathstone Holdings, LLC | 8.885 | -0,06 | 338 | -5,85 | ||||
| 2026-02-13 | 13F | Level Four Advisory Services, Llc | 23.824 | 0,00 | 907 | -5,92 | ||||
| 2026-02-17 | 13F | Toronto Dominion Bank | Call | 524.300 | -23,29 | 19.975 | -27,71 | |||
| 2026-04-02 | 13F | Hilltop National Bank | 500 | 66,67 | 22 | 100,00 | ||||
| 2026-02-13 | 13F | Lavaca Capital Llc | 300 | 0,00 | 11 | -8,33 | ||||
| 2026-02-17 | 13F | Toronto Dominion Bank | 3.369.569 | -17,70 | 128.356 | -22,44 | ||||
| 2026-02-17 | 13F | Toronto Dominion Bank | Put | 3.180.900 | 18,60 | 121.185 | 11,77 | |||
| 2026-02-11 | 13F | Simplex Trading, Llc | Call | 26.500 | 314,06 | 1.009 | ||||
| 2026-02-12 | 13F | Federated Hermes, Inc. | 243.567 | -3,96 | 9.270 | -9,66 | ||||
| 2026-04-13 | 13F | True Wealth Design, LLC | 257 | 7,98 | 12 | 22,22 | ||||
| 2026-02-11 | 13F | Simplex Trading, Llc | Put | 1.400 | 53 | |||||
| 2026-01-28 | 13F | N.E.W. Advisory Services LLC | 680 | 0,00 | 26 | -7,41 | ||||
| 2025-11-12 | 13F | Creekmur Asset Management LLC | 1.694 | 0,06 | 69 | 7,94 | ||||
| 2026-01-23 | 13F | Assetmark, Inc | 551 | -3,84 | 21 | -13,04 | ||||
| 2026-01-09 | 13F | Silver Lake Advisory, LLC | 80.306 | -1,51 | 3.056 | -7,34 | ||||
| 2026-01-21 | 13F | Flagship Harbor Advisors, Llc | 303 | 12 | ||||||
| 2026-04-17 | 13F | Cidel Asset Management Inc | 251.656 | 0,96 | 11.229 | 18,08 | ||||
| 2026-02-17 | 13F | Prosperity Consulting Group, LLC | 7.561 | 0,67 | 288 | -5,28 | ||||
| 2026-02-12 | 13F | Chilton Capital Management Llc | 8.906 | 0,00 | 339 | -6,11 | ||||
| 2026-02-13 | 13F | Neuberger Berman Group LLC | 1.346.303 | 20,97 | 51.273 | 13,89 | ||||
| 2026-02-11 | 13F | LPL Financial LLC | 98.608 | -5,32 | 3.753 | -10,92 | ||||
| 2026-02-12 | 13F | CIBC Private Wealth Group, LLC | 249.338 | -6,87 | 9.490 | -12,40 | ||||
| 2026-01-21 | 13F | Kraematon Investment Advisors, Inc | 59.639 | 0,18 | 2.270 | -5,77 | ||||
| 2026-01-26 | 13F | Private Trust Co Na | 695 | 16,42 | 26 | 8,33 | ||||
| 2026-02-10 | 13F | Bnp Paribas Arbitrage, Sa | 17.547 | 84,10 | 668 | 73,25 | ||||
| 2026-02-17 | 13F | FIL Ltd | 13.978.558 | 2,64 | 532.541 | -3,29 | ||||
| 2026-02-17 | 13F | Utah Retirement Systems | 64.927 | 0,00 | 2.477 | -5,68 | ||||
| 2026-02-11 | 13F | TCTC Holdings, LLC | 174 | 0,00 | 7 | -14,29 | ||||
| 2026-02-09 | 13F | Glenview Trust Co | 27.750 | 0,00 | 1.056 | -5,88 | ||||
| 2026-02-12 | 13F | Penserra Capital Management LLC | 36 | -25,00 | 0 | |||||
| 2026-02-13 | 13F | Citigroup Inc | 157.185 | -27,56 | 5.996 | -31,66 | ||||
| 2026-04-15 | 13F | Sl Advisors, Llc | 20.294 | 0,00 | 908 | 17,62 | ||||
| 2026-04-23 | 13F | Oppenheimer Asset Management Inc. | 20.956 | -0,28 | 938 | 17,27 | ||||
| 2026-01-20 | 13F | Cigna Investments Inc /new | 10.319 | 0,00 | 0 | |||||
| 2026-02-11 | 13F | Deutsche Bank Ag\ | 2.922.928 | -58,90 | 111.247 | -61,34 | ||||
| 2026-01-28 | 13F | HB Wealth Management, LLC | 7.446 | 36,88 | 283 | 28,64 | ||||
| 2026-01-22 | 13F | ETF Store, Inc. | 6.736 | 2,25 | 256 | -3,76 | ||||
| 2026-02-06 | 13F | Partners Group Holding AG | 9.270 | 0,00 | 353 | -5,63 | ||||
| 2026-02-13 | 13F | Toroso Investments, LLC | 30.754 | 37,07 | 1.170 | 29,00 | ||||
| 2026-02-04 | 13F | Atlantic Union Bankshares Corp | 250 | 0,00 | 10 | -10,00 | ||||
| 2026-02-12 | 13F | Quadrant Capital Group Llc | 24.552 | -1,56 | 934 | -7,43 | ||||
| 2026-02-11 | 13F | Cerity Partners LLC | 38.087 | -18,61 | 1.450 | -23,45 | ||||
| 2026-02-13 | 13F | Public Sector Pension Investment Board | 0 | -100,00 | 0 | |||||
| 2026-02-10 | 13F | Goldman Sachs Group Inc | 4.008.528 | -36,27 | 152.565 | -40,05 | ||||
| 2026-02-23 | 13F | Mv Capital Management, Inc. | 6 | 0 | ||||||
| 2026-02-13 | 13F | Morgan Dempsey Capital Management Llc | 148.446 | -9,42 | 5.650 | -14,79 | ||||
| 2026-04-08 | 13F | M.e. Allison & Co., Inc. | 7.450 | 0,00 | 333 | 17,67 | ||||
| 2026-02-17 | 13F | Man Group plc | 5.645 | 215 | ||||||
| 2026-02-06 | 13F | Pnc Financial Services Group, Inc. | 29.878 | 7,57 | 1.137 | 1,25 | ||||
| 2026-01-28 | 13F | Barrett & Company, Inc. | 7.335 | 0,76 | 279 | -5,10 | ||||
| 2025-11-04 | 13F | State of Wyoming | 0 | -100,00 | 0 | |||||
| 2026-02-06 | 13F | Larson Financial Group LLC | 1.574 | 48,63 | 60 | 40,48 | ||||
| 2026-04-07 | 13F | Farther Finance Advisors, LLC | 5.477 | 2,24 | 240 | 17,73 | ||||
| 2026-02-13 | 13F | Morgan Stanley | 4.723.159 | 45,42 | 179.763 | 36,80 | ||||
| 2026-02-17 | 13F | Credit Agricole S A | 10.433 | 1,69 | 397 | -4,34 | ||||
| 2026-02-20 | 13F | Kovitz Investment Group Partners, LLC | 0 | -100,00 | 0 | |||||
| 2026-02-10 | 13F | JTC Employer Solutions Trusteee Ltd | 12.750 | 0,00 | 0 | |||||
| 2026-02-17 | 13F | Quadrature Capital Ltd | 381.300 | 14.545 | ||||||
| 2026-01-29 | 13F | Vanguard Group Inc | 27.233.442 | 2,03 | 1.037.512 | -3,87 | ||||
| 2026-02-17 | 13F | Russell Investments Group, Ltd. | 500.754 | -1,23 | 19.101 | -6,78 | ||||
| 2026-02-12 | 13F | Scotia Capital Inc. | 6.878.969 | 7,06 | 261.658 | 1,13 | ||||
| 2026-02-13 | 13F | American Century Companies Inc | 270.104 | 15,95 | 10.290 | 9,26 | ||||
| 2026-02-17 | 13F | Lombard Odier Asset Management (Switzerland) SA | 17.358 | -71,54 | 662 | -75,89 | ||||
| 2025-11-07 | 13F | Beacon Capital Management, LLC | 0 | -100,00 | 0 | -100,00 | ||||
| 2026-02-17 | 13F | Bank Of America Corp /de/ | 6.201.529 | -15,65 | 236.030 | -20,66 | ||||
| 2026-02-12 | 13F | Qtron Investments LLC | 0 | -100,00 | 0 | |||||
| 2026-04-07 | 13F | Signaturefd, Llc | 16.674 | -5,64 | 746 | 11,01 | ||||
| 2026-02-18 | 13F | Vident Advisory, LLC | 144.792 | -9,45 | 5.527 | -14,54 | ||||
| 2026-02-13 | 13F | Ingalls & Snyder Llc | 35.426 | -0,42 | 1 | 0,00 | ||||
| 2026-02-13 | 13F | Aviso Financial Inc. | 49.893 | 15,36 | 1.901 | 8,63 | ||||
| 2026-02-06 | 13F | Cumberland Partners Ltd | 142.856 | 2,71 | 5.448 | -3,10 | ||||
| 2026-02-03 | 13F | Ethic Inc. | 14.150 | 2,00 | 539 | -4,10 | ||||
| 2026-02-17 | 13F | Worldquant Millennium Advisors Llc | 0 | -100,00 | 0 | |||||
| 2026-02-13 | 13F | Bard Associates Inc | 14.778 | -11,11 | 562 | -16,37 | ||||
| 2026-04-15 | 13F | DAVENPORT & Co LLC | 5.718 | -5,05 | 256 | 11,35 | ||||
| 2026-01-20 | 13F | Stratos Wealth Partners, LTD. | 7.091 | 0,24 | 270 | -5,94 | ||||
| 2026-02-09 | 13F | Hantz Financial Services, Inc. | 3.000 | 0 | ||||||
| 2025-11-12 | 13F | CIBC Bancorp USA Inc. | 268.724 | 10.873 | ||||||
| 2025-11-12 | 13F | Headlands Technologies LLC | 0 | -100,00 | 0 | |||||
| 2026-02-13 | 13F | Parkside Financial Bank & Trust | 71 | 0,00 | 3 | 0,00 | ||||
| 2026-02-13 | 13F | Smartleaf Asset Management LLC | 719 | 40,70 | 27 | 35,00 | ||||
| 2026-01-23 | 13F | U.S. Capital Wealth Advisors, LLC | 0 | -100,00 | 0 | -100,00 | ||||
| 2026-02-11 | 13F | Flagship Wealth Advisors, Llc | 1.534 | 0,00 | 58 | -6,45 | ||||
| 2026-02-19 | 13F | CI Private Wealth, LLC | 38.096 | -2,80 | 1.455 | -8,49 | ||||
| 2026-04-22 | 13F | Louisbourg Investments Inc. | 129.498 | -43,04 | 5.785 | -33,30 | ||||
| 2026-02-05 | 13F | Avantax Planning Partners, Inc. | 5.543 | -22,29 | 211 | -27,08 | ||||
| 2026-02-17 | 13F | Alliancebernstein L.p. | 54.615 | 0,18 | 2.079 | -5,76 | ||||
| 2026-02-12 | 13F | Dimensional Fund Advisors Lp | 2.885.514 | 23,91 | 109.826 | 16,58 | ||||
| 2026-02-12 | 13F | Nuveen, LLC | 1.716.949 | 7,60 | 65.496 | 1,49 | ||||
| 2026-02-10 | 13F | Root Financial Partners, LLC | 7 | 0 | ||||||
| 2026-02-03 | 13F | Generali Asset Management SPA SGR | 91.657 | 1,69 | 4.793 | -5,52 | ||||
| 2025-10-31 | 13F | Whittier Trust Co Of Nevada Inc | 0 | -100,00 | 0 | |||||
| 2026-01-28 | 13F | CAPROCK Group, Inc. | 8.227 | 313 | ||||||
| 2026-04-14 | 13F | Tradewinds Capital Management, LLC | 20 | 0,00 | 1 | |||||
| 2026-02-10 | 13F | One Capital Management, LLC | 10.915 | 415 | ||||||
| 2026-02-13 | 13F | Mufg Securities (canada), Ltd. | 884.716 | -7,97 | 33.713 | -13,25 | ||||
| 2026-02-10 | 13F | Envestnet Asset Management Inc | 139.324 | -56,25 | 5.303 | -58,85 | ||||
| 2026-04-22 | 13F | Advocate Investing Services LLC | 4 | 0,00 | 0 | |||||
| 2026-04-17 | 13F | A. D. Beadell Investment Counsel, Inc. | 86.255 | -0,20 | 4 | 0,00 | ||||
| 2026-02-11 | 13F | Manchester Capital Management LLC | 353 | 13 | ||||||
| 2026-02-10 | 13F | Acorn Wealth Advisors, LLC | 7.169 | -5,40 | 273 | -11,11 | ||||
| 2026-02-17 | 13F | Tortoise Capital Advisors, L.l.c. | 3.852.716 | -3,19 | 146.782 | -8,80 | ||||
| 2026-01-12 | 13F | CVA Family Office, LLC | 84 | 0,00 | 3 | 0,00 | ||||
| 2026-02-12 | 13F | Bank Of Montreal /can/ | Call | 1.400 | 53 | |||||
| 2026-02-13 | 13F | BRITISH COLUMBIA INVESTMENT MANAGEMENT Corp | 520.981 | -5,02 | 19.848 | -10,49 | ||||
| 2026-02-17 | 13F | Quantinno Capital Management LP | 131.469 | 42,51 | 5.004 | 34,06 | ||||
| 2025-10-24 | 13F | Hemington Wealth Management | 342 | 0,00 | 0 | |||||
| 2026-02-12 | 13F | Bank Of Montreal /can/ | 25.608.883 | 8,35 | 975.641 | 2,12 | ||||
| 2026-04-08 | 13F | Wealth Enhancement Advisory Services, Llc | 14.634 | -20,48 | 653 | -3,69 | ||||
| 2026-04-20 | 13F | Keudell/Morrison Wealth Management | 5.126 | 229 | ||||||
| 2026-02-17 | 13F | Raymond James Financial Inc | 89.793 | -2,76 | 3.418 | -8,54 | ||||
| 2026-02-12 | 13F | APG Asset Management N.V. | 49.495 | -10,87 | 1.608 | -15,91 | ||||
| 2026-02-13 | 13F | Y-Intercept (Hong Kong) Ltd | 0 | -100,00 | 0 | -100,00 | ||||
| 2026-02-18 | 13F | Achmea Investment Management B.V. | 0 | -100,00 | 0 | |||||
| 2026-02-17 | 13F | Guggenheim Capital Llc | 7.789 | -1,67 | 296 | -7,50 | ||||
| 2026-02-13 | 13F | First Trust Advisors Lp | 1.168.260 | 2,66 | 44.473 | -3,40 | ||||
| 2026-02-17 | 13F | Amundi | 2.935.473 | 14,95 | 111.724 | 6,32 | ||||
| 2026-02-11 | 13F | O'shaughnessy Asset Management, Llc | 105.775 | 10,88 | 4.029 | 4,49 | ||||
| 2025-11-14 | 13F | MUFG Securities EMEA plc | 0 | -100,00 | 0 | -100,00 | ||||
| 2026-04-20 | 13F | Ritholtz Wealth Management | 11.340 | 7,86 | 508 | 26,75 | ||||
| 2026-01-30 | 13F | Bogart Wealth, LLC | 1.190 | 0,00 | 45 | -6,25 | ||||
| 2026-02-09 | 13F | Legal & General Group Plc | 4.461.560 | 1,90 | 170.194 | -3,88 | ||||
| 2026-02-12 | 13F | Bank Of Nova Scotia Trust Co | 482.533 | 14,86 | 18.365 | 8,04 | ||||
| 2026-02-10 | 13F | DT Investment Partners, LLC | 1 | 0,00 | 0 | |||||
| 2026-02-17 | 13F | MIRAE ASSET GLOBAL ETFS HOLDINGS Ltd. | 3.056.592 | -2,14 | 116.334 | -7,94 | ||||
| 2026-01-28 | 13F | Cortland Associates Inc/mo | 11.939 | 0,00 | 454 | -6,00 | ||||
| 2026-02-12 | 13F | Groupe la Francaise | 9.585 | -9,45 | 366 | -14,72 | ||||
| 2026-02-10 | 13F | Hillsdale Investment Management Inc. | 917.125 | 187,36 | 35.002 | 171,30 | ||||
| 2026-02-17 | 13F | Zurich Insurance Group Ltd/FI | 0 | -100,00 | 0 | |||||
| 2026-02-17 | 13F | Canada Pension Plan Investment Board | 5.980.313 | -7,09 | 227.836 | -12,44 | ||||
| 2026-02-17 | 13F | Numerai GP LLC | 0 | -100,00 | 0 | |||||
| 2026-02-13 | 13F | Ubs Asset Management Americas Inc | 934 | 36 | ||||||
| 2026-04-06 | 13F | GAMMA Investing LLC | 84 | 0,00 | 4 | 0,00 | ||||
| 2026-02-02 | 13F | Intact Investment Management Inc. | 2.170.014 | 4,90 | 82.668 | -1,17 | ||||
| 2026-04-13 | 13F | Baskin Financial Services Inc. | 176.495 | -7,40 | 8 | 0,00 | ||||
| 2026-02-03 | 13F | ASR Vermogensbeheer N.V. | 129.172 | 0,00 | 4.927 | -5,67 | ||||
| 2026-02-13 | 13F | Barclays Plc | 102.197 | 7,19 | 3.890 | 0,83 |