Basisstatistiken
| Institutionelle Eigentümer | 443 total, 401 long only, 2 short only, 40 long/short - change of -29,03% MRQ |
| Aktienkurs | 24,65 |
| Durchschnittliche Portfolioallokation | 0.2562 % - change of -36,86% MRQ |
| Institutionelle Aktien (Long) | 168.199.737 (ex 13D/G) - change of -83,90MM shares -33,28% MRQ |
| Institutioneller Wert (Long) | $ 4.676.315 USD ($1000) |
Institutioneller Eigentümerschaft und Aktionäre
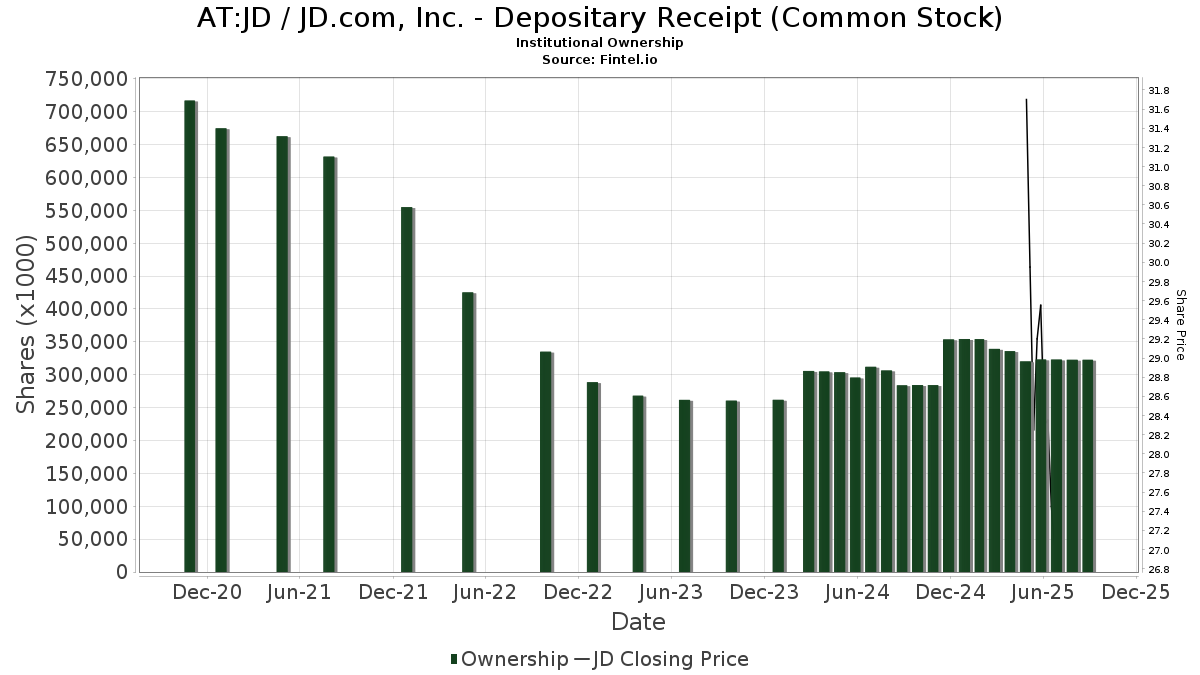
JD.com, Inc. - Depositary Receipt (Common Stock) (AT:JD) hat 443 institutionelle Eigentümer und Aktionäre, die 13D/G oder 13F Formulare bei der Securities Exchange Commission (SEC) eingereicht haben. Diese Institutionen halten insgesamt 168,199,737 Aktien. Die größten Aktionäre sind Susquehanna International Group, Llp, Susquehanna International Group, Llp, Dodge & Cox, Invesco Ltd., FIL Ltd, Discerene Group LP, CoreView Capital Management Ltd, Morgan Stanley, Citadel Advisors Llc, and IMC-Chicago, LLC .
JD.com, Inc. - Depositary Receipt (Common Stock) (WBAG:JD) Die institutionelle Eigentümerstruktur zeigt die aktuellen Positionen von Institutionen und Fonds im Unternehmen sowie die jüngsten Veränderungen der Positionsgröße. Zu den Großaktionären können Einzelanleger, Investmentfonds, Hedgefonds oder Institutionen gehören. Der Schedule 13D zeigt an, dass der Investor mehr als 5% des Unternehmens hält (oder gehalten hat) und beabsichtigt (oder beabsichtigt hat), aktiv eine Änderung der Geschäftsstrategie zu verfolgen. Schedule 13G zeigt eine passive Investition von über 5% an.
The share price as of April 2, 2026 is 24,65 / share. Previously, on May 9, 2025, the share price was 30,20 / share. This represents a decline of 18,38% over that period.
Fondsstimmung-Score
Der Fondsstimmung-Score (auch bekannt als Eigentümer-Akkumulations-Score) ermittelt die Aktien, die am meisten von Fonds gekauft werden. Er ist das Ergebnis eines ausgeklügelten quantitativen Multifaktormodells, das die Unternehmen mit den höchsten institutionellen Käufen identifiziert. Das Scoring-Modell verwendet eine Kombination aus der Gesamtzunahme der offengelegten Eigentümer, den Änderungen der Portfolioallokationen in diesen Eigentümern und anderen Metriken. Die Zahl reicht von 0 bis 100, wobei höhere Zahlen ein höheres Maß an Kapitalakkumulation als bei anderen Unternehmen anzeigen und 50 den Durchschnitt darstellt.
Aktualisierungshäufigkeit: Täglich
Siehe Ownership Explorer, der eine Liste der am höchsten bewerteten Unternehmen enthält.
AI+ Ask Fintel’s AI assistant about JD.com, Inc. - Depositary Receipt (Common Stock).
Select a question to share a public post with an AI-crafted answer.
Thinking of good questions…
13F und NPORT Einreichungen
Details zu 13F-Einreichungen sind kostenlos. Für Details zu NP-Einreichungen ist eine Premium-Mitgliedschaft erforderlich. Grüne Zeilen zeigen neue Positionen an. Rote Zeilen zeigen geschlossene Positionen an. Klicken Sie auf das Link Symbol, um den gesamten Transaktionsverlauf zu sehen.
Upgrade
um Prämiendaten freizuschalten und nach Excel zu exportieren ![]() .
.
| Datei Datum | Quelle | Anleger | Typ | Durchschnittlicher Preis (Est) |
Aktien | Δ Aktien (%) |
Gemeldeter Wert ($1000) |
Δ Wert (%) |
Port Alloc (%) |
|
|---|---|---|---|---|---|---|---|---|---|---|
| 2026-02-12 | 13F | Dimensional Fund Advisors Lp | 165.861 | -25,05 | 4.760 | -38,50 | ||||
| 2026-01-15 | 13F | Capital Advisors Inc/ok | 0 | -100,00 | 0 | |||||
| 2026-02-09 | 13F | Coldstream Capital Management Inc | 0 | -100,00 | 0 | -100,00 | ||||
| 2026-01-13 | 13F | Parsons Capital Management Inc/ri | 17.030 | 0,18 | 489 | -17,85 | ||||
| 2026-02-12 | 13F | Advisors Asset Management, Inc. | 36.320 | 13,47 | 1.042 | -6,88 | ||||
| 2026-02-10 | 13F | Crake Asset Management LLP | 236.400 | -75,02 | 6.785 | -79,51 | ||||
| 2026-03-20 | 13F/A | Hsbc Holdings Plc | Call | 44.900 | 1.286 | |||||
| 2026-02-17 | 13F | Banco Bilbao Vizcaya Argentaria, S.a. | 0 | -100,00 | 0 | |||||
| 2026-03-20 | 13F/A | Hsbc Holdings Plc | Put | 200 | 6 | |||||
| 2026-02-03 | 13F | Redwood Wealth Management Group, LLC | 10.084 | -3,42 | 289 | -20,82 | ||||
| 2026-01-29 | 13F | IMC-Chicago, LLC | 218.543 | -93,78 | 6.272 | -94,90 | ||||
| 2026-01-29 | 13F | IMC-Chicago, LLC | Put | 2.517.700 | -30,35 | 72.258 | -42,85 | |||
| 2026-01-29 | 13F | IMC-Chicago, LLC | Call | 5.271.500 | 34,56 | 151.292 | 10,40 | |||
| 2026-01-15 | 13F | Highline Wealth Partners Llc | 563 | 34,69 | 16 | 14,29 | ||||
| 2026-02-05 | 13F | Bank Julius Baer & Co. Ltd, Zurich | 0 | -100,00 | 0 | |||||
| 2026-02-06 | 13F | Global Retirement Partners, LLC | 1.899 | -6,87 | 55 | -23,94 | ||||
| 2026-02-13 | 13F | Morgan Stanley | 5.492.904 | -37,49 | 157.646 | -48,71 | ||||
| 2026-01-23 | 13F | Robeco Institutional Asset Management B.V. | 4.441.095 | 11,64 | 127.459 | -8,40 | ||||
| 2026-02-10 | 13F | State of Wyoming | 0 | -100,00 | 0 | |||||
| 2026-02-03 | 13F | Sequoia Financial Advisors, LLC | 31.818 | 105,96 | 913 | 69,07 | ||||
| 2026-02-03 | 13F | Credit Industriel Et Commercial | Put | 37.500 | 0,00 | 1.076 | -17,93 | |||
| 2026-01-07 | 13F | Aventura Private Wealth, LLC | 6 | 0,00 | 0 | |||||
| 2026-02-11 | 13F | Deutsche Bank Ag\ | 47.499 | -12,24 | 1.363 | -28,00 | ||||
| 2026-02-17 | 13F | Lonestar Capital Management LLC | 0 | -100,00 | 0 | |||||
| 2026-02-17 | 13F | Sender Co & Partners, Inc. | Call | 0 | -100,00 | 0 | ||||
| 2026-02-06 | 13F | Leonteq Securities AG | 93.672 | 17,93 | 2.688 | -3,24 | ||||
| 2026-02-06 | 13F | Leonteq Securities AG | Put | 100.000 | 941,67 | 2.870 | 756,72 | |||
| 2026-02-17 | 13F | Sender Co & Partners, Inc. | 0 | -100,00 | 0 | |||||
| 2025-11-14 | 13F | Financial Sense Advisors, Inc. | 0 | -100,00 | 0 | |||||
| 2026-02-12 | 13F | Aviva Plc | 99.664 | -6,21 | 2.860 | -23,06 | ||||
| 2026-02-17 | 13F | Sig Brokerage, Lp | Call | 14.800 | 425 | |||||
| 2026-02-13 | 13F | Brooklands Fund Management Ltd | Call | 0 | -100,00 | 0 | ||||
| 2026-01-23 | 13F | Bridgewater Advisors Inc. | 0 | -100,00 | 0 | |||||
| 2026-02-13 | 13F | Ubs Asset Management Americas Inc | 801 | 23 | ||||||
| 2026-02-02 | 13F | Ping Capital Management, Inc. | 42.000 | 1.205 | ||||||
| 2026-02-13 | 13F | NLB Skladi, upravljanje premozenja, d.o.o. | 34.965 | 1.003 | ||||||
| 2026-02-17 | 13F | Royal Bank Of Canada | 181.387 | 72,94 | 5.207 | 41,88 | ||||
| 2025-11-14 | 13F | Cubist Systematic Strategies, LLC | Call | 109.200 | 13,75 | 3.820 | 21,90 | |||
| 2026-02-13 | 13F | Bank Of Nova Scotia | 15.136 | -62,30 | 434 | -69,09 | ||||
| 2025-11-14 | 13F | Cubist Systematic Strategies, LLC | 42.456 | -87,72 | 1.485 | -86,84 | ||||
| 2026-02-03 | 13F | Manning & Napier Advisors Llc | 103.457 | -5,60 | 2.970 | -23,96 | ||||
| 2025-11-14 | 13F | Cubist Systematic Strategies, LLC | Put | 77.500 | 1.213,56 | 2.711 | 1.311,46 | |||
| 2025-11-14 | 13F | Wetherby Asset Management Inc | 24.617 | -3,71 | 861 | 3,24 | ||||
| 2026-02-12 | 13F | Principal Securities, Inc. | 0 | -100,00 | 0 | -100,00 | ||||
| 2026-02-17 | 13F | Qube Research & Technologies Ltd | 0 | -100,00 | 0 | |||||
| 2026-02-02 | 13F | Truist Financial Corp | 13.435 | -38,64 | 386 | -49,67 | ||||
| 2026-02-12 | 13F | Sit Investment Associates Inc | 0 | -100,00 | 0 | |||||
| 2026-02-12 | 13F | Federation des caisses Desjardins du Quebec | 8.200 | 1,33 | 235 | -16,96 | ||||
| 2026-01-13 | 13F | CoreCap Advisors, LLC | 24 | 0,00 | 1 | |||||
| 2026-02-17 | 13F | Parallax Volatility Advisers, L.P. | Put | 615.400 | -6,26 | 17.662 | -23,09 | |||
| 2026-02-06 | 13F | Gsa Capital Partners Llp | 16.156 | -4,29 | 0 | |||||
| 2026-02-17 | 13F | Parallax Volatility Advisers, L.P. | Call | 1.352.000 | 21,50 | 38.802 | -0,32 | |||
| 2025-11-13 | 13F | Total Investment Management Inc | 0 | -100,00 | 0 | |||||
| 2025-11-13 | 13F | Boston Partners | 0 | -100,00 | 0 | |||||
| 2026-02-03 | 13F | RD Finance Ltd | 40.750 | -50,00 | 1 | -50,00 | ||||
| 2026-02-17 | 13F | Parallax Volatility Advisers, L.P. | 12.030 | -92,23 | 345 | -93,63 | ||||
| 2026-01-23 | 13F | Rsm Us Wealth Management Llc | 39.237 | -0,62 | 1.126 | -18,46 | ||||
| 2026-02-12 | 13F | Skopos Labs, Inc. | 36.370 | 81,47 | 1.065 | 51,78 | ||||
| 2025-10-20 | 13F | CenterStar Asset Management, LLC | Call | 0 | -100,00 | 0 | ||||
| 2026-02-09 | 13F | Integrity Alliance, Llc. | 16.376 | 470 | ||||||
| 2026-02-17 | 13F | MIRAE ASSET GLOBAL ETFS HOLDINGS Ltd. | 66.942 | -13,55 | 1.921 | -29,11 | ||||
| 2026-01-20 | 13F | AdvisorNet Financial, Inc | 0 | -100,00 | 0 | |||||
| 2026-03-09 | 13F | Flax Pond Capital, Llc | 83.942 | 2.409 | ||||||
| 2026-02-13 | 13F | Allianz Se | 5.601 | 0,00 | 161 | -17,95 | ||||
| 2026-02-17 | 13F | XTX Topco Ltd | 23.816 | -49,59 | 684 | -58,66 | ||||
| 2026-02-03 | 13F | NewEdge Wealth, LLC | 154.827 | 4.444 | ||||||
| 2026-02-17 | 13F | Russell Investments Group, Ltd. | 598.188 | -39,72 | 17.168 | -50,91 | ||||
| 2026-02-12 | 13F | Quadrant Capital Group Llc | 20.643 | 333,86 | 592 | 256,63 | ||||
| 2026-02-12 | 13F | Intesa Sanpaolo Wealth Management | 0 | 0 | ||||||
| 2026-02-17 | 13F | EFG International AG | 1.270 | 36 | ||||||
| 2026-02-11 | 13F | LPL Financial LLC | Call | 54.000 | 480,65 | 1.550 | 376,62 | |||
| 2026-02-12 | 13F | Federated Hermes, Inc. | 2.619.476 | 15,89 | 75.179 | -4,92 | ||||
| 2026-02-12 | 13F | Scotia Capital Inc. | 0 | -100,00 | 0 | |||||
| 2025-11-07 | 13F | Sierra Ocean, Llc | 0 | -100,00 | 0 | |||||
| 2025-11-14 | 13F | Binnacle Investments Inc | 750 | 365,84 | 26 | 420,00 | ||||
| 2026-02-13 | 13F | Wexford Capital Lp | 1.367 | 12,14 | 39 | -7,14 | ||||
| 2026-02-03 | 13F | Harel Insurance Investments & Financial Services Ltd. | 292 | 0,00 | 0 | |||||
| 2026-02-17 | 13F | Steamboat Capital Partners, LLC | 44.250 | -0,06 | 1.270 | -18,02 | ||||
| 2026-02-24 | 13F | Bell Investment Advisors, Inc | 436 | 34,15 | 13 | 9,09 | ||||
| 2026-02-13 | 13F | Mariner, LLC | 24.398 | -9,91 | 700 | -26,08 | ||||
| 2026-02-13 | 13F | Centerpoint Advisors, LLC | 25 | 0,00 | 0 | |||||
| 2026-01-22 | 13F | Triad Wealth Partners, LLC | 9.205 | 0,12 | 264 | -17,76 | ||||
| 2026-02-09 | 13F | Fisher Asset Management, LLC | 3.331.848 | -1,24 | 95.624 | -18,97 | ||||
| 2026-02-02 | 13F | Cornerstone Planning Group LLC | 550 | 22,22 | 16 | 6,67 | ||||
| 2026-02-13 | 13F | Pathstone Holdings, LLC | 16.391 | -15,81 | 470 | -30,98 | ||||
| 2025-11-13 | 13F | Clear Street Markets Llc | 0 | -100,00 | 0 | |||||
| 2026-02-05 | 13F | Cambridge Investment Research Advisors, Inc. | 17.994 | 68,53 | 1 | |||||
| 2026-02-05 | 13F | Td Private Client Wealth Llc | 1 | 0,00 | 0 | |||||
| 2025-11-03 | 13F | Hallmark Capital Management Inc | 0 | -100,00 | 0 | -100,00 | ||||
| 2026-02-06 | 13F | IFP Advisors, Inc | 1.418 | -66,35 | 41 | -72,79 | ||||
| 2026-02-03 | 13F | Ballentine Partners, LLC | 11.554 | -16,30 | 332 | -31,33 | ||||
| 2026-02-17 | 13F | Grantham, Mayo, Van Otterloo & Co. LLC | 0 | -100,00 | 0 | |||||
| 2025-11-13 | 13F | Causeway Capital Management Llc | 0 | -100,00 | 0 | -100,00 | ||||
| 2026-01-26 | 13F | Main Street Group, LTD | 0 | -100,00 | 0 | -100,00 | ||||
| 2026-02-13 | 13F | Macquarie Group Ltd | 0 | -100,00 | 0 | |||||
| 2026-02-17 | 13F | Raymond James Financial Inc | Call | 100 | 0,00 | 5 | 0,00 | |||
| 2026-02-17 | 13F | Raymond James Financial Inc | 107.266 | 21,81 | 3.079 | -0,06 | ||||
| 2025-11-06 | 13F | BridgePort Financial Solutions, LLC | 0 | -100,00 | 0 | |||||
| 2026-02-18 | 13F | Warther Private Wealth, LLC | 0 | -100,00 | 0 | |||||
| 2026-01-16 | 13F | Tempus Wealth Planning, LLC | 30.984 | 16,57 | 889 | -4,31 | ||||
| 2026-02-17 | 13F | Citadel Advisors Llc | Put | 5.145.200 | -17,41 | 147.667 | -32,24 | |||
| 2026-02-17 | 13F | Citadel Advisors Llc | 2.787.360 | -9,42 | 79.997 | -25,68 | ||||
| 2026-01-26 | 13F | Patriot Financial Group Insurance Agency, LLC | 10.329 | -0,27 | 296 | -18,23 | ||||
| 2026-02-11 | 13F | Franklin Resources Inc | 9.559 | -42,06 | 274 | -52,51 | ||||
| 2026-02-17 | 13F | Bayesian Capital Management, LP | 0 | -100,00 | 0 | |||||
| 2025-11-12 | 13F | Anfield Capital Management, LLC | 0 | -100,00 | 0 | |||||
| 2026-02-10 | 13F | Monaco Asset Management SAM | 160.000 | 60,00 | 4.592 | 31,28 | ||||
| 2025-11-14 | 13F | XY Capital Ltd | 0 | -100,00 | 0 | |||||
| 2026-02-17 | 13F | Citadel Advisors Llc | Call | 5.350.800 | -37,74 | 153.568 | -48,92 | |||
| 2026-02-10 | 13F | Nomura Asset Management Co Ltd | 14.850 | 0,00 | 426 | -17,92 | ||||
| 2026-02-12 | 13F | BlackRock, Inc. | 4.455.661 | 23,56 | 127.877 | 1,37 | ||||
| 2026-02-13 | 13F | Brooklands Fund Management Ltd | 68 | 19 | ||||||
| 2026-02-17 | 13F | Balyasny Asset Management Llc | 163.614 | 4.696 | ||||||
| 2026-02-17 | 13F | Balyasny Asset Management Llc | Call | 816.200 | -27,31 | 23.425 | -40,37 | |||
| 2026-02-17 | 13F | Balyasny Asset Management Llc | Put | 863.800 | 85,80 | 24.791 | 52,45 | |||
| 2026-02-05 | 13F | Atria Investments Llc | 8.047 | -31,16 | 231 | -43,63 | ||||
| 2026-02-11 | 13F | Jessup Wealth Management, Inc | 1.050 | 30 | ||||||
| 2026-02-10 | 13F/A | Guinness Atkinson Asset Management Inc | 32.438 | 0,00 | 949 | -17,91 | ||||
| 2026-02-03 | 13F | SBI Securities Co., Ltd. | 12.224 | 36,11 | 351 | 11,46 | ||||
| 2026-02-17 | 13F | ExodusPoint Capital Management, LP | Call | 0 | -100,00 | 0 | -100,00 | |||
| 2026-02-17 | 13F | Newlands Management Operations LLC | 0 | -100,00 | 0 | |||||
| 2025-11-03 | 13F | Scion Asset Management, LLC | Call | 0 | -100,00 | 0 | -100,00 | |||
| 2026-02-17 | 13F | Capstone Investment Advisors, Llc | Call | 0 | -100,00 | 0 | -100,00 | |||
| 2026-02-17 | 13F | Capstone Investment Advisors, Llc | Put | 0 | -100,00 | 0 | -100,00 | |||
| 2026-02-13 | 13F | L1 Capital Pty Ltd | 730.264 | 20.959 | ||||||
| 2026-01-23 | 13F | Assetmark, Inc | 1.158 | 11,03 | 33 | -8,33 | ||||
| 2026-02-13 | 13F | Caxton Associates Llp | 0 | -100,00 | 0 | |||||
| 2025-11-14 | 13F | Wolverine Trading, Llc | Put | 625.200 | 46,07 | 22.282 | 57,44 | |||
| 2026-01-23 | 13F | Ritholtz Wealth Management | 84.748 | -3,35 | 2.432 | -20,70 | ||||
| 2026-02-11 | 13F | LPL Financial LLC | 250.687 | 1,19 | 7.195 | -16,99 | ||||
| 2026-02-17 | 13F | Jones Financial Companies Lllp | 32.302 | 8,68 | 927 | -9,56 | ||||
| 2026-02-10 | 13F | Natixis Advisors, L.p. | 72.244 | -4,34 | 2 | 0,00 | ||||
| 2026-02-17 | 13F | Equitable Holdings, Inc. | 19.723 | -21,43 | 566 | -35,54 | ||||
| 2026-01-30 | 13F | Us Bancorp \de\ | 25.749 | -37,47 | 739 | -48,75 | ||||
| 2026-02-10 | 13F | Baker Avenue Asset Management, LP | 110.752 | 6,74 | 3.179 | -12,43 | ||||
| 2025-11-14 | 13F | Wolverine Trading, Llc | 351.661 | 1.059,07 | 12.533 | 1.149,55 | ||||
| 2026-01-22 | 13F | Glass Jacobson Investment Advisors llc | 25 | 0,00 | 1 | |||||
| 2026-02-13 | 13F | Discerene Group LP | 6.210.851 | 0,00 | 178.251 | -17,95 | ||||
| 2026-02-17 | 13F | Massar Capital Management, LP | 110.200 | 0,00 | 3.163 | -17,96 | ||||
| 2025-11-14 | 13F | Wolverine Trading, Llc | Call | 942.300 | 66,16 | 33.584 | 79,08 | |||
| 2026-02-02 | 13F | Davis Selected Advisers | 329.221 | -3,66 | 9.449 | -20,96 | ||||
| 2026-01-30 | 13F | Mitsubishi UFJ Trust & Banking Corp | 296.208 | -11,10 | 8.501 | -27,06 | ||||
| 2026-02-17 | 13F | Delaware Management Holdings, Inc. | 1.751.720 | 50.274 | ||||||
| 2026-02-10 | 13F | Bnp Paribas Arbitrage, Sa | Put | 0 | -100,00 | 0 | -100,00 | |||
| 2026-02-17 | 13F | TB Capital Gestao de Recursos Ltda. | 0 | -100,00 | 0 | |||||
| 2026-02-17 | 13F | Advisor Group Holdings, Inc. | 72.853 | -33,12 | 2.091 | -41,37 | ||||
| 2025-11-07 | 13F | Beacon Capital Management, LLC | 0 | -100,00 | 0 | |||||
| 2026-02-13 | 13F | Charles Schwab Investment Management Inc | 4.250.324 | 15,27 | 121.984 | -5,43 | ||||
| 2026-02-17 | 13F | CoreView Capital Management Ltd | 6.197.455 | 0,00 | 177.867 | -17,95 | ||||
| 2026-01-13 | 13F | Syquant Capital Sas | 1.230.769 | 35 | ||||||
| 2026-02-17 | 13F | Synergy Financial Group, LTD | 8.763 | 4,51 | 251 | -14,33 | ||||
| 2026-02-17 | 13F | Caption Management, LLC | Put | 0 | -100,00 | 0 | -100,00 | |||
| 2026-02-09 | 13F | Legal & General Group Plc | 1.545.460 | 4,75 | 44.346 | -14,07 | ||||
| 2026-02-12 | 13F | North of South Capital LLP | 4.253.012 | 4,42 | 122.061 | -14,33 | ||||
| 2026-01-27 | 13F | WealthCollab, LLC | 484 | 0,00 | 14 | -18,75 | ||||
| 2026-02-13 | 13F | Dodge & Cox | 12.194.648 | -35,11 | 349.986 | -46,76 | ||||
| 2025-10-30 | 13F | Ridgewood Investments LLC | 18.759 | 316,87 | 656 | 349,32 | ||||
| 2026-01-08 | 13F | True Wealth Design, LLC | 26 | -67,09 | 1 | -100,00 | ||||
| 2026-02-17 | 13F | Bellevue Group AG | 11.000 | 316 | ||||||
| 2025-11-12 | 13F | Orland Properties Ltd | 0 | -100,00 | 0 | |||||
| 2026-01-27 | 13F | Evergreen Capital Management Llc | 0 | -100,00 | 0 | |||||
| 2026-01-16 | 13F | Compagnie Lombard Odier SCmA | 900 | -81,05 | 26 | -84,94 | ||||
| 2026-02-11 | 13F | Mirae Asset Securities (usa) Inc. | Put | 100.245 | 2.870 | |||||
| 2026-02-05 | 13F | Abacus Wealth Partners, LLC | 12.368 | 355 | ||||||
| 2026-02-10 | 13F | Parametrica Management Ltd | 0 | -100,00 | 0 | |||||
| 2026-02-02 | 13F | Qrg Capital Management, Inc. | 24.369 | -25,03 | 699 | -38,47 | ||||
| 2026-02-02 | 13F | Wolverine Asset Management Llc | Call | 12.800 | 367 | |||||
| 2026-02-10 | 13F | Measured Wealth Private Client Group, LLC | 1 | 0 | ||||||
| 2026-02-06 | 13F | Banque Cantonale Vaudoise | 72.051 | 51,29 | 2.068 | 206.700,00 | ||||
| 2026-02-17 | 13F/A | Kovack Advisors, Inc. | 7.134 | 205 | ||||||
| 2026-01-21 | 13F | Greenleaf Trust | 8.005 | -5,89 | 230 | -22,90 | ||||
| 2026-02-12 | 13F | Hollencrest Capital Management | 168 | 0,00 | 5 | -20,00 | ||||
| 2026-02-17 | 13F | Nomura Holdings Inc | 60.110 | -52,10 | 1.725 | -60,70 | ||||
| 2025-10-22 | 13F | Geneos Wealth Management Inc. | 0 | -100,00 | 0 | |||||
| 2026-02-17 | 13F | Nomura Holdings Inc | Call | 138.600 | 0,00 | 3.978 | -17,97 | |||
| 2026-02-10 | 13F | Texas Yale Capital Corp. | 14.008 | 2,94 | 402 | -15,55 | ||||
| 2026-02-12 | 13F | Triumph Capital Management | 653 | 21.666,67 | 19 | |||||
| 2026-02-17 | 13F | Owl Creek Asset Management, L.P. | 0 | -100,00 | 0 | |||||
| 2026-01-26 | 13F | PDS Planning, Inc | 7.693 | -6,57 | 221 | -23,61 | ||||
| 2026-02-04 | 13F | Drive Wealth Management, Llc | 0 | -100,00 | 0 | |||||
| 2026-02-13 | 13F | Citigroup Inc | Put | 620.000 | 90,77 | 17.794 | 56,53 | |||
| 2026-02-13 | 13F | Marathon Trading Investment Management LLC | 605.197 | 34,56 | 17.369 | 10,41 | ||||
| 2026-02-05 | 13F | Bessemer Group Inc | 0 | 0 | ||||||
| 2026-02-11 | 13F | J.w. Cole Advisors, Inc. | 0 | -100,00 | 0 | |||||
| 2026-02-03 | 13F | Gateway Investment Advisers Llc | 7.862 | 0,18 | 226 | -17,88 | ||||
| 2026-02-12 | 13F | BRYN MAWR TRUST Co | 0 | -100,00 | 0 | -100,00 | ||||
| 2026-02-13 | 13F | Marathon Trading Investment Management LLC | Call | 79.300 | -70,26 | 2.276 | -75,60 | |||
| 2026-02-13 | 13F | Marathon Trading Investment Management LLC | Put | 884.800 | 30,04 | 25.394 | 6,69 | |||
| 2025-11-12 | 13F | West Family Investments, Inc. | 0 | -100,00 | 0 | |||||
| 2026-01-14 | 13F | Generali Investments CEE, investicni spolecnost, a.s. | 27.526 | -25,25 | 790 | -38,74 | ||||
| 2026-01-22 | 13F | Maseco Llp | 70 | 0,00 | 2 | 0,00 | ||||
| 2026-02-17 | 13F | Tower Research Capital LLC (TRC) | 81 | 97,56 | 2 | 100,00 | ||||
| 2025-11-03 | 13F | Eos Management, L.P. | 0 | -100,00 | 0 | |||||
| 2025-11-12 | 13F | Headlands Technologies LLC | 0 | -100,00 | 0 | |||||
| 2026-02-11 | 13F | First Command Advisory Services, Inc. | 300 | 0,00 | 9 | -20,00 | ||||
| 2026-01-20 | 13F | Polunin Capital Partners Ltd | 1.947.668 | -1,23 | 56 | -18,84 | ||||
| 2026-01-14 | 13F | TrueMark Investments, LLC | 70.611 | 14,94 | 2.027 | -5,68 | ||||
| 2026-03-31 | 13F | Sankala Group LLC | 46 | 0,00 | 1 | 0,00 | ||||
| 2026-01-29 | 13F | Coronation Fund Managers Ltd. | 8.741 | -31,59 | 251 | -43,95 | ||||
| 2026-02-17 | 13F | Cetera Investment Advisers | 96.480 | -11,54 | 2.769 | -27,44 | ||||
| 2026-02-17 | 13F | Millennium Management Llc | Call | 1.840.900 | -25,02 | 52.834 | -38,48 | |||
| 2026-02-17 | 13F | Millennium Management Llc | Put | 793.400 | -58,99 | 22.771 | -66,35 | |||
| 2026-02-20 | 13F/A | CMT Capital Markets Trading GmbH | Put | 96.000 | -43,36 | 3 | -60,00 | |||
| 2026-02-17 | 13F | Millennium Management Llc | 408.989 | -58,47 | 11.738 | -65,93 | ||||
| 2026-02-20 | 13F/A | CMT Capital Markets Trading GmbH | Call | 511.800 | 88,44 | 15 | 55,56 | |||
| 2026-02-03 | 13F | Strengthening Families & Communities, LLC | 1.700 | 49 | ||||||
| 2025-11-13 | 13F | AI-Squared Management Ltd | 0 | -100,00 | 0 | |||||
| 2026-02-17 | 13F | Guggenheim Capital Llc | 41.960 | -10,73 | 1.204 | -26,76 | ||||
| 2026-02-13 | 13F | Peak6 Llc | Put | 696.000 | 16,86 | 19.975 | -4,12 | |||
| 2025-11-13 | 13F | Arrowstreet Capital, Limited Partnership | 0 | -100,00 | 0 | |||||
| 2026-02-13 | 13F | Peak6 Llc | 142.275 | -71,32 | 4.083 | -76,47 | ||||
| 2026-02-13 | 13F | Peak6 Llc | Call | 17.200 | -94,41 | 494 | -95,42 | |||
| 2026-02-19 | 13F | CI Private Wealth, LLC | 81.127 | 158,43 | 738 | -32,79 | ||||
| 2026-02-17 | 13F | Ardmore Road Asset Management LP | 0 | -100,00 | 0 | |||||
| 2025-11-14 | 13F | Lombard Odier Asset Management (Europe) Ltd | 18.482 | |||||||
| 2026-02-13 | 13F | Van Eck Associates Corp | 201.811 | -32,28 | 6 | -50,00 | ||||
| 2026-02-06 | 13F | Fairtree Asset Management (Pty) Ltd | 178.173 | 8,26 | 5.114 | -11,17 | ||||
| 2026-02-12 | 13F | Campbell & CO Investment Adviser LLC | 0 | -100,00 | 0 | |||||
| 2026-02-09 | 13F | Todd Asset Management Llc | 887.059 | -20,56 | 25.459 | -34,82 | ||||
| 2026-02-17 | 13F | J. Goldman & Co LP | Call | 0 | -100,00 | 0 | ||||
| 2026-02-09 | 13F | Huntington National Bank | 1.432 | -27,09 | 41 | -39,71 | ||||
| 2026-02-12 | 13F | CIBC Private Wealth Group, LLC | 496 | -27,70 | 14 | -39,13 | ||||
| 2026-01-21 | 13F | Future Financial Wealth Managment LLC | 0 | -100,00 | 0 | |||||
| 2026-01-27 | 13F | Institute for Wealth Management, LLC. | 9.969 | -11,92 | 286 | -27,59 | ||||
| 2026-02-09 | 13F | Guinness Asset Management LTD | 5.443 | 10,86 | 159 | -8,62 | ||||
| 2026-02-12 | 13F | Alps Advisors Inc | 16.837 | 0,89 | 483 | -17,15 | ||||
| 2026-02-09 | 13F | Hantz Financial Services, Inc. | 27.160 | 59,31 | 1 | |||||
| 2026-02-03 | 13F | Costello Asset Management, INC | 200 | 6 | ||||||
| 2026-01-21 | 13F | Prime Capital Investment Advisors, LLC | 22.034 | -13,32 | 632 | -28,91 | ||||
| 2026-02-11 | 13F | Vise Technologies, Inc. | 51.216 | 5,62 | 1.470 | -13,38 | ||||
| 2026-02-17 | 13F | Amundi | 159.005 | -47,01 | 4.563 | -57,65 | ||||
| 2026-01-09 | 13F | SG Americas Securities, LLC | Put | 156.800 | -91,20 | 1 | ||||
| 2026-02-17 | 13F | Farringdon Capital, Ltd. | 0 | -100,00 | 0 | |||||
| 2025-11-05 | 13F | Renaissance Group Llc | 0 | -100,00 | 0 | -100,00 | ||||
| 2026-01-30 | 13F | Harbor Advisors LLC | 14.000 | 0,00 | 402 | -18,00 | ||||
| 2026-02-05 | 13F | High Note Wealth, LLC | 0 | -100,00 | 0 | |||||
| 2026-01-09 | 13F | SG Americas Securities, LLC | Call | 279.800 | 94,58 | 0 | ||||
| 2026-02-18 | 13F | Mackenzie Financial Corp | 290.637 | 0,75 | 8.328 | -17,47 | ||||
| 2025-11-13 | 13F | Riggs Asset Managment Co. Inc. | 0 | -100,00 | 0 | |||||
| 2026-01-29 | 13F | Anchyra Partners Llc | 7.009 | 201 | ||||||
| 2025-11-13 | 13F | Capital International Investors | 0 | -100,00 | 0 | |||||
| 2026-02-17 | 13F | Marathon Asset Management Lp | 75.000 | 50,00 | 2.136 | 22,13 | ||||
| 2026-01-09 | 13F | 180 Wealth Advisors, Llc | 18.895 | 4,63 | 542 | -14,10 | ||||
| 2026-01-22 | 13F | Trilogy Capital Inc. | Call | 118.500 | 13,40 | 53 | -81,56 | |||
| 2026-01-22 | 13F | Trilogy Capital Inc. | 215.903 | 26,81 | 6.196 | 4,05 | ||||
| 2025-10-30 | 13F | Twin Peaks Wealth Advisors, LLC | 0 | -100,00 | 0 | |||||
| 2025-11-13 | 13F | Eisler Capital Management Ltd. | Put | 705.300 | 476,23 | 24.643 | 516,85 | |||
| 2026-02-11 | 13F | Modus Advisors, LLC | 1.833 | 53 | ||||||
| 2026-02-17 | 13F | Summit Trail Advisors, Llc | 0 | -100,00 | 0 | |||||
| 2025-11-06 | 13F | CENTRAL TRUST Co | 0 | -100,00 | 0 | |||||
| 2025-11-13 | 13F | Eisler Capital Management Ltd. | 3.317 | -93,21 | 116 | -92,79 | ||||
| 2025-11-13 | 13F | Eisler Capital Management Ltd. | Call | 180.300 | 555,64 | 6.300 | 602,23 | |||
| 2026-02-03 | 13F | Maxi Investments CY Ltd | 19.000 | 0,00 | 1 | |||||
| 2026-02-06 | 13F | GPS Wealth Strategies Group, LLC | 0 | -100,00 | 0 | |||||
| 2026-02-13 | 13F | Boreal Capital Management LLC | 0 | -100,00 | 0 | |||||
| 2026-01-08 | 13F | Aurora Investment Managers, LLC. | 273.077 | 1,33 | 8 | -22,22 | ||||
| 2026-03-10 | 13F | PeakShares LLC | 3.500 | 100 | ||||||
| 2026-01-27 | 13F | Bayforest Capital Ltd | 2.789 | -78,12 | 80 | -82,02 | ||||
| 2026-02-06 | 13F | Fortis Group Advisors, LLC | 8.802 | -88,22 | 251 | -89,87 | ||||
| 2026-02-10 | 13F | CIBC World Markets Inc. | 259.519 | 15,22 | 7.448 | -5,47 | ||||
| 2026-02-11 | 13F | IMA Wealth, Inc. | 61 | 2 | ||||||
| 2026-01-09 | 13F | Assenagon Asset Management S.A. | 1.135.700 | 8,10 | 32.595 | -11,30 | ||||
| 2026-01-15 | 13F | Range Financial Group LLC | 62.366 | 1.790 | ||||||
| 2025-11-03 | 13F | Wealthspan Partners, Llc | Call | 665 | ||||||
| 2026-01-14 | 13F | Exchange Traded Concepts, Llc | 211.139 | 21,59 | 6.060 | -0,25 | ||||
| 2025-10-29 | 13F | Arkadios Wealth Advisors | 0 | -100,00 | 0 | |||||
| 2026-01-28 | 13F | B. Metzler seel. Sohn & Co. AG | 0 | -100,00 | 0 | |||||
| 2025-11-14 | 13F | Caption Management, LLC | Call | 0 | -100,00 | 0 | -100,00 | |||
| 2026-02-14 | 13F | Militia Capital Partners, LP | 57.500 | 0,00 | 1.650 | -17,95 | ||||
| 2025-10-15 | 13F | Norden Group Llc | 0 | -100,00 | 0 | |||||
| 2026-02-23 | 13F | Leonteq Securities AG | Call | 0 | -100,00 | 0 | -100,00 | |||
| 2026-02-13 | 13F | Walleye Trading LLC | Call | 1.229.400 | 54,49 | 35.284 | 26,75 | |||
| 2026-02-13 | 13F | Parkside Financial Bank & Trust | 24 | 0,00 | 1 | |||||
| 2026-02-13 | 13F | Walleye Trading LLC | 1.365.657 | -57,39 | 39.194 | -65,04 | ||||
| 2026-02-13 | 13F | Walleye Trading LLC | Put | 5.255.600 | 45,73 | 150.836 | 19,56 | |||
| 2026-04-02 | 13F | Byrne Asset Management LLC | 0 | -100,00 | 0 | |||||
| 2026-01-30 | 13F | Archer Investment Corp | 61 | 0,00 | 2 | -50,00 | ||||
| 2025-11-14 | 13F | Infusive Asset Management Inc. | 0 | -100,00 | 0 | |||||
| 2026-01-14 | 13F | Congress Park Capital LLC | 7.325 | 210 | ||||||
| 2025-11-14 | 13F | Silvercrest Asset Management Group Llc | 0 | -100,00 | 0 | -100,00 | ||||
| 2026-02-13 | 13F | Sei Investments Co | 97.797 | 88,08 | 2.807 | 54,35 | ||||
| 2026-02-13 | 13F | Mml Investors Services, Llc | 15.268 | -6,31 | 438 | -23,16 | ||||
| 2025-11-12 | 13F | Transce3nd, LLC | 0 | -100,00 | 0 | |||||
| 2026-02-06 | 13F | Larson Financial Group LLC | 845 | -41,96 | 24 | -52,00 | ||||
| 2026-02-13 | 13F | Smartleaf Asset Management LLC | 207 | -17,20 | 6 | -37,50 | ||||
| 2026-02-13 | 13F | Atlas Capital Advisors Llc | 14.589 | -11,82 | 419 | -22,45 | ||||
| 2026-02-17 | 13F | Lazard Asset Management Llc | 426.292 | 10,37 | 12.235 | -9,44 | ||||
| 2026-02-17 | 13F | Dark Forest Capital Management Lp | 0 | -100,00 | 0 | |||||
| 2026-02-17 | 13F | Mercer Global Advisors Inc /adv | 13.680 | -15,08 | 393 | -30,37 | ||||
| 2026-02-12 | 13F | Steward Partners Investment Advisory, Llc | 1.325 | -67,88 | 38 | -73,61 | ||||
| 2026-02-13 | 13F | Capula Management Ltd | Call | 0 | -100,00 | 0 | -100,00 | |||
| 2026-01-26 | 13F | Quadrant Private Wealth Management, LLC | 32.818 | 4,05 | 942 | -14,69 | ||||
| 2026-02-11 | 13F | O'shaughnessy Asset Management, Llc | 230.285 | -18,90 | 6.609 | -33,46 | ||||
| 2026-02-13 | 13F | Pinpoint Asset Management (Singapore) Pte. Ltd. | 7.245 | 208 | ||||||
| 2026-02-17 | 13F | Elequin Capital Lp | 442 | 13 | ||||||
| 2025-11-06 | 13F | Blume Capital Management, Inc. | 0 | -100,00 | 0 | |||||
| 2026-01-23 | 13F | Brown, Lisle/cummings, Inc. | 85 | 0,00 | 2 | 0,00 | ||||
| 2026-02-09 | 13F | Frazier Financial Advisors, LLC | 0 | -100,00 | 0 | |||||
| 2025-11-14 | 13F | Jain Global LLC | 0 | -100,00 | 0 | |||||
| 2025-11-04 | 13F | Veritas Asset Management LLP | 0 | -100,00 | 0 | -100,00 | ||||
| 2026-02-10 | 13F | Greenwich Wealth Management LLC | 0 | -100,00 | 0 | |||||
| 2026-02-13 | 13F | JustInvest LLC | 28.851 | 0,32 | 828 | -17,69 | ||||
| 2026-01-15 | 13F | Royal Fund Management, LLC | Call | 0 | -100,00 | 0 | ||||
| 2026-01-15 | 13F | Royal Fund Management, LLC | 0 | -100,00 | 0 | |||||
| 2026-02-20 | 13F | Sunbelt Securities, Inc. | 7.520 | 0,00 | 216 | -18,25 | ||||
| 2026-02-12 | 13F | SWAN Capital LLC | 35 | 0,00 | 1 | 0,00 | ||||
| 2026-02-17 | 13F | Appaloosa Lp | 4.157.046 | -33,22 | 119.307 | -45,21 | ||||
| 2026-01-21 | 13F | Lakeshore Capital Group, Inc. | 16.401 | 3,24 | 471 | -15,32 | ||||
| 2026-01-14 | 13F | Spire Wealth Management | 264 | 0,00 | 8 | -22,22 | ||||
| 2026-02-09 | 13F | Rooted Wealth Advisors, Inc. | 0 | -100,00 | 0 | |||||
| 2026-02-17 | 13F | Private Advisor Group, LLC | 74.024 | -7,31 | 2.124 | -23,95 | ||||
| 2026-02-13 | 13F | Bridgefront Capital, LLC | 11.695 | 336 | ||||||
| 2026-02-17 | 13F | Ancora Advisors, LLC | 86 | -76,31 | 2 | -83,33 | ||||
| 2026-02-17 | 13F | Long Focus Capital Management, Llc | 896.183 | 36,74 | 25.720 | 12,19 | ||||
| 2026-02-13 | 13F | Fifth Lane Capital, Lp | 0 | -100,00 | 0 | |||||
| 2026-02-13 | 13F | American Century Companies Inc | 565.977 | 163,62 | 16.244 | 116,28 | ||||
| 2025-11-14 | 13F | Axa S.a. | 0 | -100,00 | 0 | |||||
| 2026-02-17 | 13F | Quantinno Capital Management LP | 65.835 | 5,79 | 1.889 | -13,19 | ||||
| 2026-02-17 | 13F | HighVista Strategies LLC | 17.463 | -25,32 | 501 | -38,68 | ||||
| 2025-11-13 | 13F | Rehmann Capital Advisory Group | 0 | -100,00 | 0 | |||||
| 2026-02-06 | 13F | Handelsbanken Fonder AB | 357.000 | -48,03 | 10 | -58,33 | ||||
| 2026-02-20 | 13F/A | CMT Capital Markets Trading GmbH | 20.350 | -69,85 | 1 | -100,00 | ||||
| 2025-11-13 | 13F | Norges Bank | 0 | -100,00 | 0 | |||||
| 2026-01-16 | 13F | FNY Investment Advisers, LLC | 27.200 | -34,51 | 1 | -100,00 | ||||
| 2026-02-13 | 13F | Gts Securities Llc | 14.985 | -65,13 | 430 | -71,39 | ||||
| 2026-02-17 | 13F | Engineers Gate Manager LP | 113.955 | 3.271 | ||||||
| 2026-02-11 | 13F | Vermillion Wealth Management, Inc. | 121 | 0,00 | 3 | -25,00 | ||||
| 2026-02-13 | 13F | First Trust Advisors Lp | 165.394 | 10,72 | 4.747 | -9,17 | ||||
| 2025-10-31 | 13F | Whittier Trust Co | 0 | -100,00 | 0 | |||||
| 2026-02-13 | 13F | Polymer Capital Management (HK) LTD | 120.000 | 1.900,00 | 3.444 | 1.547,85 | ||||
| 2026-02-12 | 13F | Groupe la Francaise | 0 | -100,00 | 0 | |||||
| 2026-01-20 | 13F | Perpetual Ltd | 577.410 | 1,60 | 16.572 | -16,64 | ||||
| 2026-01-29 | 13F | Vanguard Group Inc | 0 | -100,00 | 0 | -100,00 | ||||
| 2026-02-10 | 13F | Clear Harbor Asset Management, LLC | 27.349 | -9,24 | 785 | -25,62 | ||||
| 2026-02-03 | 13F | Ethic Inc. | 36.685 | -2,11 | 1.053 | -19,69 | ||||
| 2026-02-02 | 13F | Wolverine Asset Management Llc | Put | 181.400 | 70,49 | 5.206 | 39,91 | |||
| 2026-02-05 | 13F | Park Square Financial Group, LLC | 379 | 13 | ||||||
| 2026-02-05 | 13F | Rahlfs Capital, Llc | 7.550 | 0,00 | 217 | -18,18 | ||||
| 2026-02-13 | 13F | Nfj Investment Group, Llc | 699.518 | 61,79 | 20.076 | 32,75 | ||||
| 2026-01-23 | 13F | Sumitomo Mitsui Trust Holdings, Inc. | 8.875 | 0,00 | 255 | -18,06 | ||||
| 2026-02-17 | 13F | ADAR1 Capital Management, LLC | 10.000 | 0,00 | 287 | -17,77 | ||||
| 2026-02-17 | 13F | Rexford Capital Inc | 300 | 0,00 | 9 | -20,00 | ||||
| 2026-02-11 | 13F | Parallel Advisors, LLC | 4.996 | -1,60 | 143 | -19,21 | ||||
| 2026-02-18 | 13F | Galaxy Group Investments LLC | 0 | -100,00 | 0 | |||||
| 2026-02-04 | 13F | HighPoint Advisor Group LLC | 32.327 | -37,53 | 928 | -48,78 | ||||
| 2026-01-27 | 13F | TD Waterhouse Canada Inc. | 3.490 | 149,29 | 100 | 100,00 | ||||
| 2026-02-17 | 13F | DZ BANK AG Deutsche Zentral Genossenschafts Bank, Frankfurt am Main | 42.897 | 8,35 | 1.240 | -10,27 | ||||
| 2026-02-13 | 13F/A | Alberta Investment Management Corp | 0 | -100,00 | 0 | |||||
| 2026-01-26 | 13F | KBC Group NV | 256.828 | -8,61 | 7 | -22,22 | ||||
| 2026-02-17 | 13F | Prelude Capital Management, Llc | 24.328 | -39,79 | 698 | -50,60 | ||||
| 2025-11-14 | 13F | ExodusPoint Capital Management, LP | 0 | -100,00 | 0 | -100,00 | ||||
| 2026-02-17 | 13F | Toronto Dominion Bank | 24 | -99,92 | 1 | -100,00 | ||||
| 2026-02-12 | 13F | Elevated Private Wealth, LLC | 31.738 | 911 | ||||||
| 2025-10-15 | 13F | BSW Wealth Partners | 0 | -100,00 | 0 | |||||
| 2026-02-13 | 13F | Walleye Capital LLC | 382.586 | 234,66 | 10.980 | 174,64 | ||||
| 2026-02-11 | 13F | Group One Trading, L.p. | Put | 826.000 | 98,37 | 23.706 | 62,76 | |||
| 2026-02-11 | 13F | Group One Trading, L.p. | Call | 5.227.300 | 134,68 | 150.024 | 92,55 | |||
| 2026-02-13 | 13F | Stifel Financial Corp | 24.575 | -51,82 | 705 | -60,48 | ||||
| 2026-02-13 | 13F | Platinum Investment Management Ltd | 30.853 | -16,77 | 885 | -31,71 | ||||
| 2026-02-11 | 13F | Group One Trading, L.p. | 462.670 | 0,23 | 13.279 | -17,76 | ||||
| 2026-02-14 | 13F | Rockefeller Capital Management L.P. | 99.858 | 132,07 | 2.866 | 90,37 | ||||
| 2026-02-17 | 13F | Yiheng Capital Management, L.P. | 687.413 | -12,70 | 19.729 | -28,37 | ||||
| 2026-02-17 | 13F | Equitec Proprietary Markets, Llc | 125 | 0,00 | 4 | -25,00 | ||||
| 2026-01-27 | 13F | Revisor Wealth Management LLC | 7.894 | 232 | ||||||
| 2026-02-13 | 13F | Fairman Group, LLC | 150 | 0,00 | 4 | -20,00 | ||||
| 2026-02-02 | 13F | Mutual Advisors, LLC | 10.324 | 296 | ||||||
| 2026-02-12 | 13F | Brown Brothers Harriman & Co | 3.857 | 15,72 | 111 | -5,17 | ||||
| 2026-02-13 | 13F | Rhumbline Advisers | 5.424 | -7,79 | 156 | -24,39 | ||||
| 2026-02-13 | 13F | William B. Walkup & Associates, Inc. | 10 | 0,00 | 0 | |||||
| 2026-02-17 | 13F | Brevan Howard Capital Management LP | Call | 135.300 | 0,00 | 3.883 | -17,94 | |||
| 2026-02-13 | 13F | Walleye Capital LLC | Call | 149.200 | 414,48 | 4.282 | 322,29 | |||
| 2026-02-12 | 13F | Callan Family Office, LLC | 7.076 | -24,33 | 203 | -37,92 | ||||
| 2026-02-13 | 13F | Walleye Capital LLC | Put | 889.700 | 2.895,62 | 25.534 | 2.359,92 | |||
| 2026-01-30 | 13F | Pekin Hardy Strauss, Inc. | 152.051 | 4.364 | ||||||
| 2026-03-31 | 13F | Hamrick Investment Counsel, llc | 260 | 7 | ||||||
| 2026-02-06 | 13F | Pnc Financial Services Group, Inc. | 59.537 | -6,90 | 1.709 | -23,65 | ||||
| 2026-02-10 | 13F | Envestnet Asset Management Inc | 40.840 | 16,97 | 1.172 | -4,01 | ||||
| 2026-02-13 | 13F | Patient Capital Management, LLC | 0 | -100,00 | 0 | |||||
| 2026-02-17 | 13F | Two Sigma Advisers, Lp | 0 | -100,00 | 0 | -100,00 | ||||
| 2026-01-16 | 13F | Formidable Asset Management, LLC | 59.437 | -13,37 | 2.079 | -7,15 | ||||
| 2026-02-18 | 13F | Ctc Llc | Put | 271 | -57,66 | 778 | -65,28 | |||
| 2026-01-26 | 13F | Provenance Wealth Advisors, LLC | 429 | 0,00 | 12 | -20,00 | ||||
| 2026-02-18 | 13F | Ctc Llc | 19.391 | -48,00 | 557 | -57,36 | ||||
| 2025-11-12 | 13F | Brinker Capital Investments, LLC | 0 | -100,00 | 0 | -100,00 | ||||
| 2026-01-20 | 13F | Thurston, Springer, Miller, Herd & Titak, Inc. | 1.806 | 5.211,76 | 52 | 5.000,00 | ||||
| 2026-02-03 | 13F | Crossmark Global Holdings, Inc. | 100.716 | -9,24 | 2.891 | -25,53 | ||||
| 2026-02-18 | 13F | Ctc Llc | Call | 81 | -57,59 | 232 | -65,27 | |||
| 2026-02-02 | 13F | Danske Bank A/s | 16 | 0,00 | 0 | |||||
| 2026-02-17 | 13F | Yiheng Capital Management, L.P. | Call | 0 | -100,00 | 0 | ||||
| 2026-01-29 | 13F | Teachers Retirement System Of The State Of Kentucky | 618.560 | -17,23 | 18 | -34,62 | ||||
| 2026-02-13 | 13F | Pine Valley Investments Ltd Liability Co | Call | 6.492 | 2.722,17 | |||||
| 2026-02-12 | 13F | DRW Securities, LLC | 9.569 | 275 | ||||||
| 2026-02-13 | 13F | Pine Valley Investments Ltd Liability Co | 327.437 | 36.001,10 | 9.397 | 30.212,90 | ||||
| 2026-02-17 | 13F | Schonfeld Strategic Advisors LLC | Call | 0 | -100,00 | 0 | ||||
| 2026-02-17 | 13F | DV Trading LLC | 12 | 0 | ||||||
| 2026-01-21 | 13F | Yousif Capital Management, Llc | 22.310 | 0,00 | 633 | -18,85 | ||||
| 2026-01-13 | 13F | Avaii Wealth Management, Llc | 0 | -100,00 | 0 | |||||
| 2026-02-17 | 13F | Credit Agricole S A | 140.961 | 152,60 | 4.046 | 107,33 | ||||
| 2026-01-29 | 13F | UMA Financial Services, Inc. | 112 | -44,00 | 3 | -50,00 | ||||
| 2026-01-08 | 13F | Adirondack Trust Co | 70 | 0,00 | 2 | 0,00 | ||||
| 2026-02-10 | 13F | Foundations Investment Advisors, LLC | 0 | -100,00 | 0 | |||||
| 2026-02-18 | 13F | Wahed Invest LLC | 27.638 | 6,87 | 793 | -12,28 | ||||
| 2026-02-11 | 13F | Janney Montgomery Scott LLC | 27.061 | 25,82 | 1 | |||||
| 2026-02-17 | 13F | Opal Capital Llc | 70.623 | 2.027 | ||||||
| 2026-01-29 | 13F | Nbc Securities, Inc. | 157 | 0,00 | 5 | -20,00 | ||||
| 2025-11-12 | 13F | Bellwether Advisors, LLC | 0 | -100,00 | 0 | |||||
| 2026-02-12 | 13F | Raiffeisen Bank International AG | Call | 446 | -20,64 | 11 | -42,11 | |||
| 2026-02-09 | 13F | Delta Asset Management Llc/tn | 35.000 | 0,00 | 1.004 | -17,97 | ||||
| 2026-01-13 | 13F | Mather Group, Llc. | 0 | -100,00 | 0 | |||||
| 2026-01-16 | 13F | First Pacific Financial | 13.815 | -4,51 | 396 | -21,74 | ||||
| 2026-01-16 | 13F | Matauro, Llc | 104.307 | -27,30 | 2.994 | -40,35 | ||||
| 2026-02-17 | 13F | D. E. Shaw & Co., Inc. | Call | 2.100.600 | 234,44 | 60.287 | 174,41 | |||
| 2026-02-17 | 13F | D. E. Shaw & Co., Inc. | Put | 4.284.400 | 14,76 | 122.962 | -5,84 | |||
| 2026-02-17 | 13F | D. E. Shaw & Co., Inc. | 915.784 | -26,60 | 26.283 | -39,78 | ||||
| 2026-02-17 | 13F | Jump Financial, LLC | 0 | -100,00 | 0 | |||||
| 2026-01-26 | 13F | Mirae Asset Global Investments Co., Ltd. | 56.912 | 0,63 | 1.633 | -17,44 | ||||
| 2025-10-21 | 13F | Steel Peak Wealth Management LLC | 0 | -100,00 | 0 | -100,00 | ||||
| 2026-02-17 | 13F | Shay Capital LLC | 0 | -100,00 | 0 | |||||
| 2025-12-16 | 13F | Garde Capital, Inc. | 0 | -100,00 | 0 | -100,00 | ||||
| 2026-02-17 | 13F | Shay Capital LLC | Call | 0 | -100,00 | 0 | ||||
| 2026-02-17 | 13F | Lakewood Capital Management, Lp | 639.050 | 43,98 | 18.341 | 18,13 | ||||
| 2025-10-29 | 13F | Meitav Dash Investments Ltd | 0 | -100,00 | 0 | |||||
| 2025-11-20 | 13F | Maven Securities LTD | Call | 0 | -100,00 | 0 | ||||
| 2026-02-06 | 13F | Abn Amro Investment Solutions | 0 | -100,00 | 0 | |||||
| 2026-02-17 | 13F | TCG Advisory Services, LLC | Call | 0 | -100,00 | 0 | ||||
| 2026-02-12 | 13F | Renaissance Technologies Llc | 0 | -100,00 | 0 | |||||
| 2026-02-11 | 13F | Barrow Hanley Mewhinney & Strauss Llc | 3.565.777 | -7,16 | 102.338 | -23,82 | ||||
| 2026-02-12 | 13F | Douglass Winthrop Advisors, LLC | 10.280 | 0,00 | 295 | -17,83 | ||||
| 2025-11-10 | 13F | Transatlantique Private Wealth Llc | 0 | -100,00 | 0 | |||||
| 2025-11-12 | 13F | Victory Capital Management Inc | 0 | -100,00 | 0 | |||||
| 2026-01-16 | 13F | Ronald Blue Trust, Inc. | 347 | -46,62 | 10 | -59,09 | ||||
| 2026-02-13 | 13F | National Bank Of Canada /fi/ | 10.126 | -49,48 | 290 | -58,57 | ||||
| 2026-02-10 | 13F | Murphy & Mullick Capital Management Corp | 100 | 0,00 | 3 | -33,33 | ||||
| 2026-02-13 | 13F | Integrated Wealth Concepts LLC | 0 | -100,00 | 0 | |||||
| 2026-02-02 | 13F | Highland Capital Management, Llc | 17.000 | -9,33 | 488 | -25,65 | ||||
| 2026-02-13 | 13F | Venture Visionary Partners LLC | Call | 0 | -100,00 | 0 | ||||
| 2026-02-12 | 13F | New York State Common Retirement Fund | 102.100 | -9,24 | 2.930 | -25,54 | ||||
| 2026-02-13 | 13F | Colony Group, LLC | 13.604 | -12,14 | 403 | -25,51 | ||||
| 2026-01-30 | 13F | Jackson Hole Capital Partners, LLC | 12.100 | 0,00 | 347 | -17,97 | ||||
| 2026-02-09 | 13F | Eaton Financial Holdings Company, LLC | 14.096 | 405 | ||||||
| 2026-02-10 | 13F | NINE MASTS CAPITAL Ltd | 273.890 | 7.861 | ||||||
| 2026-02-17 | 13F | Tiger Global Management Llc | 344.309 | 0,00 | 9.882 | -17,95 | ||||
| 2025-11-05 | 13F | BI Asset Management Fondsmaeglerselskab A/S | 0 | -100,00 | 0 | |||||
| 2025-11-04 | 13F | Principal Financial Group Inc | 0 | -100,00 | 0 | |||||
| 2026-02-13 | 13F | Oasis Management Co Ltd. | 165.160 | 0,00 | 4.740 | -17,95 | ||||
| 2026-02-12 | 13F | Insigneo Advisory Services, Llc | 8.072 | -28,66 | 232 | -41,52 | ||||
| 2026-01-28 | 13F | CAPROCK Group, Inc. | 12.304 | -19,49 | 353 | -25,53 | ||||
| 2026-01-23 | 13F | Wallace Advisory Group, LLC | 20.925 | -0,95 | 601 | -12,92 | ||||
| 2026-02-11 | 13F | Gwn Securities Inc. | 17.228 | 65,81 | 494 | 36,09 | ||||
| 2026-02-11 | 13F | Greykasell Wealth Strategies, Inc. | 2.633 | 0,00 | 76 | -18,48 | ||||
| 2026-02-17 | 13F | SageView Advisory Group, LLC | 1.009 | 29 | ||||||
| 2026-02-05 | 13F | Allworth Financial LP | 2.275 | 24,32 | 65 | 1,56 | ||||
| 2026-02-13 | 13F | Schroder Investment Management Group | 81.600 | -87,57 | 2.342 | -89,80 | ||||
| 2026-02-17 | 13F | Alden Global Capital LLC | 113.219 | 3.249 | ||||||
| 2026-01-28 | 13F | Financial Perspectives, Inc | 3.068 | 0,00 | 88 | -17,76 | ||||
| 2026-02-11 | 13F | Contrarius Group Holdings Ltd | 781.692 | 22.435 | ||||||
| 2025-11-14 | 13F | Mangrove Partners | 0 | -100,00 | 0 | |||||
| 2026-02-17 | 13F | Creative Planning | 320.340 | -6,66 | 9.194 | -23,42 | ||||
| 2025-11-12 | 13F | NewSquare Capital LLC | 0 | -100,00 | 0 | -100,00 | ||||
| 2026-02-18 | 13F | Vident Advisory, LLC | 23.860 | -16,72 | 685 | -31,74 | ||||
| 2026-02-13 | 13F | MAI Capital Management | 1.278 | -11,19 | 37 | -28,00 | ||||
| 2026-02-17 | 13F | SIH Partners, LLLP | 4.991.448 | 74,15 | 143.255 | 42,88 | ||||
| 2026-01-28 | 13F | Migdal Insurance & Financial Holdings Ltd. | 13.024 | -13,31 | 0 | |||||
| 2026-01-23 | 13F | Capital Investment Counsel, Inc | 0 | -100,00 | 0 | |||||
| 2026-02-19 | 13F | Invesco Ltd. | 9.926.442 | -24,02 | 284.889 | -37,66 | ||||
| 2026-02-13 | 13F | Venture Visionary Partners LLC | 0 | -100,00 | 0 | |||||
| 2026-02-10 | 13F | Root Financial Partners, LLC | 1.120 | 1.020,00 | 32 | 966,67 | ||||
| 2026-02-17 | 13F | Limestone Investment Advisors LP | 74.080 | 0,00 | 2.126 | -17,95 | ||||
| 2026-02-17 | 13F | Limestone Investment Advisors LP | Call | 300 | 9 | |||||
| 2026-02-13 | 13F | Hurley Capital, LLC | Call | 47 | -32,86 | 2 | -50,00 | |||
| 2026-02-17 | 13F | Susquehanna International Group, Llp | 3.308.813 | 36,56 | 94.963 | 12,04 | ||||
| 2026-01-28 | 13F | N.E.W. Advisory Services LLC | 770 | 0,00 | 22 | -15,38 | ||||
| 2025-10-30 | 13F | Ridgewood Investments LLC | Call | 0 | -100,00 | 0 | -100,00 | |||
| 2026-02-04 | 13F | Knuff & Co LLC | 0 | -100,00 | 0 | |||||
| 2026-01-29 | 13F | Sanctuary Advisors, LLC | 0 | -100,00 | 0 | -100,00 | ||||
| 2026-02-10 | 13F | Channing Global Advisors, Llc | 17.355 | 0,37 | 498 | -17,55 | ||||
| 2026-02-17 | 13F | Susquehanna International Group, Llp | Put | 12.425.200 | 14,07 | 356.603 | -6,41 | |||
| 2026-02-17 | 13F | Susquehanna International Group, Llp | Call | 16.255.700 | -26,56 | 466.539 | -39,75 | |||
| 2026-01-30 | 13F | Mizuho Securities Co. Ltd. | 9.100 | 0,00 | 261 | -17,92 | ||||
| 2026-02-06 | 13F | EverSource Wealth Advisors, LLC | 1.124 | -5,15 | 32 | -21,95 | ||||
| 2026-02-17 | 13F | Summit Global Investments | 0 | -100,00 | 0 | |||||
| 2026-02-13 | 13F | Hurley Capital, LLC | 140 | 0,00 | 4 | 0,00 | ||||
| 2026-02-17 | 13F | Private Advisor Group, LLC | Call | 0 | -100,00 | 0 | ||||
| 2026-02-18 | 13F | GWM Advisors LLC | 0 | -100,00 | 0 | |||||
| 2026-01-28 | 13F | City State Bank | 1.840 | 0,00 | 53 | -18,75 | ||||
| 2026-02-13 | 13F | Wells Fargo & Company/mn | 297.919 | 58,83 | 8.550 | 30,32 | ||||
| 2026-02-09 | 13F | Prospera Financial Services Inc | 20.713 | 15,52 | 594 | -5,26 | ||||
| 2026-02-13 | 13F | Healthcare Of Ontario Pension Plan Trust Fund | 0 | -100,00 | 0 | |||||
| 2026-02-10 | 13F | Bank of New York Mellon Corp | 61.196 | -1,11 | 1.756 | -18,85 | ||||
| 2026-02-13 | 13F | Alkeon Capital Management Llc | 1.471.173 | -41,71 | 42.223 | -52,17 | ||||
| 2026-03-05 | 13F | Bayban | 30 | 1 | ||||||
| 2025-11-10 | 13F | Raiffeisen Bank International AG | 0 | -100,00 | 0 | -100,00 | ||||
| 2026-02-13 | 13F | Kestra Advisory Services, LLC | 0 | -100,00 | 0 | |||||
| 2026-02-17 | 13F | Garden State Investment Advisory Services LLC | 0 | -100,00 | 0 | |||||
| 2026-02-12 | 13F | Barometer Capital Management Inc. | 39.332 | 82,09 | 938 | 24,24 | ||||
| 2026-02-13 | 13F | Toroso Investments, LLC | 18.481 | 22,81 | 530 | 0,76 | ||||
| 2026-02-09 | 13F | Smithfield Trust Co | 0 | -100,00 | 0 | |||||
| 2026-01-05 | 13F | GK Wealth Management LLC | 22.407 | -3,33 | 643 | -20,62 | ||||
| 2026-02-17 | 13F | Eddie Patel Inc | 9.852 | 283 | ||||||
| 2026-01-30 | 13F | FengHe Fund Management Pte. Ltd. | 0 | -100,00 | 0 | |||||
| 2026-01-21 | 13F | Stone House Investment Management, LLC | 0 | -100,00 | 0 | |||||
| 2026-01-29 | 13F | UBS Group AG | Put | 1.771.600 | -0,86 | 50.845 | -18,66 | |||
| 2026-01-29 | 13F | UBS Group AG | Call | 954.428 | -11,65 | 27.392 | -27,51 | |||
| 2026-01-29 | 13F | UBS Group AG | 4.446.624 | -16,89 | 127.618 | -31,81 | ||||
| 2026-02-17 | 13F | Quadrature Capital Ltd | 0 | -100,00 | 0 | |||||
| 2026-02-03 | 13F | Orion Capital Management LLC | 0 | -100,00 | 0 | |||||
| 2026-01-08 | 13F | Gradient Investments LLC | 53.529 | 61,14 | 1.536 | 32,30 | ||||
| 2026-01-28 | 13F | Quaker Wealth Management, LLC | 3.047 | 87 | ||||||
| 2026-02-09 | 13F | Accent Capital Management, LLC | 275 | 0,00 | 8 | -22,22 | ||||
| 2025-10-31 | 13F | Scalar Gauge Management, Llc | 0 | -100,00 | 0 | -100,00 | ||||
| 2026-01-30 | 13F | Bogart Wealth, LLC | 150 | -56,52 | 4 | -66,67 | ||||
| 2026-02-19 | 13F | Atomi Financial Group, Inc. | Call | 0 | -100,00 | 0 | ||||
| 2026-02-06 | 13F | Saranac Partners Ltd | 0 | -100,00 | 0 | -100,00 | ||||
| 2026-01-26 | 13F | Abbington Investment Group | 0 | -100,00 | 0 | |||||
| 2026-02-17 | 13F | Man Group plc | Put | 20.000 | 574 | |||||
| 2026-02-17 | 13F | Ameriprise Financial Inc | 157.397 | -69,96 | 4.544 | -75,22 | ||||
| 2026-02-17 | 13F | Toronto Dominion Bank | Call | 149.900 | -50,00 | 4.315 | -58,86 | |||
| 2025-11-17 | 13F | FSA Wealth Management LLC | 21 | 0,00 | 1 | |||||
| 2026-02-09 | 13F | Harbour Investments, Inc. | 595 | -17,93 | 17 | -32,00 | ||||
| 2026-01-20 | 13F | Quintet Private Bank (Europe) S.A. | 8.313 | 0,00 | 239 | -17,93 | ||||
| 2026-02-09 | 13F | Geode Capital Management, Llc | 399.029 | -1,83 | 11.452 | -19,45 | ||||
| 2026-02-03 | 13F | Washington Trust Advisors, Inc. | 25 | 0,00 | 1 | |||||
| 2026-02-06 | 13F | ProShare Advisors LLC | 53.045 | 6,91 | 1.522 | -12,28 | ||||
| 2026-02-09 | 13F | Hartland & Co., LLC | 15 | 0 | ||||||
| 2026-03-06 | 13F | Hsbc Holdings Plc | 250.115 | -15,37 | 7.171 | -30,56 | ||||
| 2026-02-13 | 13F | Kilter Group LLC | 48 | 0,00 | 1 | 0,00 | ||||
| 2026-02-17 | 13F | CastleKnight Management LP | 0 | -100,00 | 0 | |||||
| 2025-10-27 | 13F | Concurrent Investment Advisors, LLC | 0 | -100,00 | 0 | -100,00 | ||||
| 2026-02-05 | 13F | High Note Wealth, LLC | Call | 0 | -100,00 | 0 | ||||
| 2026-02-17 | 13F | LMR Partners LLP | 5.494 | -98,16 | 158 | -98,50 | ||||
| 2026-02-23 | 13F | Virtu Financial LLC | 0 | -100,00 | 0 | |||||
| 2026-02-17 | 13F | LMR Partners LLP | Call | 125.200 | 18,67 | 3.593 | -2,63 | |||
| 2026-02-13 | 13F | Altrafin AG | 0 | -100,00 | 0 | |||||
| 2026-02-17 | 13F | Qube Research & Technologies Ltd | Put | 357.700 | 85,24 | 10.266 | 51,98 | |||
| 2026-02-12 | 13F | Glaxis Capital Management, LLC | 0 | -100,00 | 0 | |||||
| 2026-02-17 | 13F | Qube Research & Technologies Ltd | Call | 1.727.200 | 146,11 | 49.571 | 101,93 | |||
| 2026-02-13 | 13F | Oakum Bay Capital LLC | 5.700 | 164 | ||||||
| 2026-03-05 | 13F | Gunpowder Capital Management, LLC dba Oliver Wealth Management | 6.156 | 177 | ||||||
| 2026-02-09 | 13F | Jefferies Financial Group Inc. | Call | 265.000 | 1.666,67 | 7.606 | 1.351,34 | |||
| 2026-02-11 | 13F | Cerity Partners LLC | 11.533 | -38,59 | 331 | -49,70 | ||||
| 2026-02-10 | 13F/A | Northwestern Mutual Wealth Management Co | 109.774 | 13,12 | 3.151 | -7,19 | ||||
| 2026-02-11 | 13F | Jpmorgan Chase & Co | Put | 25.000 | -41,18 | 718 | -51,75 | |||
| 2025-11-14 | 13F | Wood Tarver Financial Group, LLC | 0 | -100,00 | 0 | |||||
| 2026-02-13 | 13F | Hudson Bay Capital Management LP | 0 | -100,00 | 0 | |||||
| 2026-02-11 | 13F | Jpmorgan Chase & Co | 674.577 | 3,32 | 19.360 | -15,23 | ||||
| 2026-02-17 | 13F | Man Group plc | Call | 20.000 | 574 | |||||
| 2025-11-13 | 13F | Kayne Anderson Rudnick Investment Management Llc | 0 | -100,00 | 0 | |||||
| 2026-02-06 | 13F | HighTower Advisors, LLC | 1.384.810 | 69,70 | 39.744 | 39,24 | ||||
| 2026-02-11 | 13F | Jpmorgan Chase & Co | Call | 338.300 | -17,97 | 9.709 | -32,69 | |||
| 2026-02-17 | 13F | Man Group plc | 364.822 | -75,07 | 10.470 | -79,55 | ||||
| 2026-02-09 | 13F | Jefferies Financial Group Inc. | 10.050 | 117,72 | 288 | 78,88 | ||||
| 2026-02-17 | 13F | Armistice Capital, Llc | 0 | -100,00 | 0 | |||||
| 2025-11-05 | 13F | SOUTH STATE Corp | 0 | -100,00 | 0 | |||||
| 2025-10-21 | 13F | Jarislowsky, Fraser Ltd | 66.790 | -11,19 | 2.336 | -4,81 | ||||
| 2026-01-15 | 13F | Frank, Rimerman Advisors LLC | 11.252 | 323 | ||||||
| 2026-01-22 | 13F | Harwood Advisory Group, LLC | 18 | 0,00 | 1 | |||||
| 2026-01-13 | 13F | Kathmere Capital Management, LLC | 8.793 | 0,16 | 252 | -17,92 | ||||
| 2025-11-07 | 13F | CenterBook Partners LP | 50.269 | 127,37 | 1.758 | 143,83 | ||||
| 2026-01-23 | 13F | Farther Finance Advisors, LLC | 17.685 | -34,87 | 508 | -46,58 | ||||
| 2026-02-13 | 13F | BNP Paribas Asset Management Holding S.A. | 212.132 | 11 | ||||||
| 2025-10-24 | 13F | ORG Partners LLC | 0 | -100,00 | 0 | |||||
| 2026-02-12 | 13F | Commonwealth Equity Services, Llc | 45.094 | 11,44 | 1.294 | 129.300,00 | ||||
| 2026-02-12 | 13F | Qtron Investments LLC | 0 | -100,00 | 0 | |||||
| 2026-02-17 | 13F | CWM Advisors, LLC | 1.311 | 38 | ||||||
| 2026-02-17 | 13F | Cresset Asset Management, LLC | 7.190 | 206 | ||||||
| 2026-02-11 | 13F | Nemes Rush Group LLC | Call | 300 | 0,00 | 0 | -100,00 | |||
| 2026-02-13 | 13F | Cornerstone Financial Management LLC | 73 | 2 | ||||||
| 2026-02-04 | 13F | NAN FUNG TRINITY (HK) Ltd | 649.700 | 35,16 | 18.646 | 10,90 | ||||
| 2026-02-26 | 13F/A | Banque Transatlantique SA | 3.877 | 0,00 | 111 | -17,78 | ||||
| 2025-11-04 | 13F | Guerra Advisors Inc | 16 | 1 | ||||||
| 2026-02-17 | 13F | Schonfeld Strategic Advisors LLC | 17.200 | -96,70 | 494 | -97,30 | ||||
| 2026-02-18 | 13F/A | Empowered Funds, LLC | 13.023 | 374 | ||||||
| 2026-01-28 | 13F | DekaBank Deutsche Girozentrale | 232.800 | 0,00 | 8 | -12,50 | ||||
| 2026-02-13 | 13F | Citigroup Inc | 839.349 | 640,16 | 24.089 | 507,39 | ||||
| 2026-02-13 | 13F | Citigroup Inc | Call | 535.000 | 12,63 | 15.354 | -7,59 | |||
| 2026-02-13 | 13F | 1832 Asset Management L.P. | 56.864 | 1.632 | ||||||
| 2025-10-31 | 13F | Cheviot Value Management, LLC | 0 | -100,00 | 0 | |||||
| 2026-02-06 | 13F | Lsv Asset Management | 5.100 | 155,00 | 0 | |||||
| 2026-02-06 | 13F | Profund Advisors Llc | 86.267 | -18,91 | 2.476 | -33,49 | ||||
| 2026-02-13 | 13F | Granville Capital, Inc. | 8.705 | 250 | ||||||
| 2026-02-17 | 13F | Susquehanna Advisors Group, Inc. | Put | 2.670.000 | -39,70 | 76.629 | -50,52 | |||
| 2026-02-24 | 13F | DGS Capital Management, LLC | 0 | -100,00 | 0 | -100,00 | ||||
| 2026-02-17 | 13F | Susquehanna Advisors Group, Inc. | 2.670.000 | -39,70 | 76.629 | -50,52 | ||||
| 2026-02-17 | 13F | Ionic Capital Management LLC | Call | 0 | -100,00 | 0 | ||||
| 2026-01-12 | 13F | Arkfeld Wealth Strategies, L.L.C. | 12.742 | -0,02 | 370 | -18,18 | ||||
| 2026-01-28 | 13F | Oversea-Chinese Banking CORP Ltd | 54.792 | 1.604 | ||||||
| 2026-02-13 | 13F | Centiva Capital, LP | 1.090.821 | 31.307 | ||||||
| 2026-02-13 | 13F | Pinnacle Wealth Planning Services, Inc. | 431 | 12 | ||||||
| 2026-01-12 | 13F | Abound Wealth Management | 301 | -38,70 | 9 | -52,94 | ||||
| 2026-02-10 | 13F | Main Management ETF Advisors, LLC | 46.980 | 1,03 | 1 | 0,00 | ||||
| 2026-02-13 | 13F | Centiva Capital, LP | Put | 4.005.400 | 142,74 | 114.955 | 99,16 | |||
| 2025-11-06 | 13F | Roman Butler Fullerton & Co | 0 | -100,00 | 0 | |||||
| 2026-02-05 | 13F | Pacitti Group Inc. | 0 | -100,00 | 0 | |||||
| 2026-02-13 | 13F | Centiva Capital, LP | Call | 302.000 | -71,64 | 8.667 | -76,73 | |||
| 2026-01-05 | 13F | Rosenberg Matthew Hamilton | 0 | -100,00 | 0 | |||||
| 2026-02-11 | 13F | Simplex Trading, Llc | Call | 5.032.400 | 0,92 | 144.430 | 82.905,17 | |||
| 2026-02-17 | 13F | PharVision Advisers, LLC | 0 | -100,00 | 0 | -100,00 | ||||
| 2026-02-13 | 13F | Prudential Financial Inc | 111.200 | -7,49 | 3.191 | -24,10 | ||||
| 2026-02-13 | 13F | Solstein Capital, LLC | 13.439 | 74,44 | 386 | 43,12 | ||||
| 2025-11-14 | 13F | Hillhouse Capital Advisors, Ltd. | 0 | -100,00 | 0 | |||||
| 2026-02-11 | 13F | Simplex Trading, Llc | Put | 1.714.400 | -38,84 | 49.203 | 50.107,14 | |||
| 2026-02-11 | 13F | Simplex Trading, Llc | 288.008 | -59,49 | 8.266 | 34.337,50 | ||||
| 2026-02-17 | 13F | Wealth Watch Advisors, INC | 3 | 0 | ||||||
| 2026-01-16 | 13F | Empirical Financial Services, LLC d.b.a. Empirical Wealth Management | 0 | -100,00 | 0 | |||||
| 2026-02-11 | 13F | Fox Run Management, L.l.c. | 0 | -100,00 | 0 | |||||
| 2026-02-03 | 13F/A | Mount Yale Investment Advisors, LLC | 0 | -100,00 | 0 | -100,00 | ||||
| 2026-02-19 | 13F | Atomi Financial Group, Inc. | 22.612 | 2,57 | 649 | -15,95 | ||||
| 2026-02-17 | 13F | Strive Financial Group ,LLC | 59 | 2 | ||||||
| 2026-02-13 | 13F | Capula Management Ltd | Put | 1.330.000 | 38.171 | |||||
| 2026-02-17 | 13F | Advisory Services Network, LLC | 7.497 | -29,25 | 215 | -41,89 | ||||
| 2026-02-13 | 13F | Capula Management Ltd | 1.330.000 | 38.171 | ||||||
| 2026-02-17 | 13F | Public Employees Retirement System Of Ohio | 210.206 | 0,00 | 6.033 | -17,97 | ||||
| 2026-02-13 | 13F | State Street Corp | 134.113 | 26,84 | 3.849 | 4,08 | ||||
| 2026-01-07 | 13F | Harbour Capital Advisors, LLC | 21.450 | 0,54 | 633 | -14,92 | ||||
| 2026-02-12 | 13F | Hrt Financial Lp | 107.600 | -4,61 | 3 | -25,00 | ||||
| 2026-02-10 | 13F | Bnp Paribas Arbitrage, Sa | 905.513 | -34,21 | 25.988 | -46,02 | ||||
| 2025-10-07 | 13F | Proathlete Wealth Management Llc | 0 | -100,00 | 0 | |||||
| 2026-01-20 | 13F | Signaturefd, Llc | 13.726 | -4,28 | 394 | -21,56 | ||||
| 2026-02-10 | 13F | Bnp Paribas Arbitrage, Sa | Call | 1.068 | -84,66 | 3.065 | -87,41 | |||
| 2026-01-14 | 13F | Jfs Wealth Advisors, Llc | 43 | 0,00 | 1 | 0,00 | ||||
| 2025-11-06 | 13F | Midwest Trust Co | 0 | -100,00 | 0 | |||||
| 2026-02-09 | 13F | Keating Financial Advisory Services, Inc. | 4 | 0 | ||||||
| 2025-11-25 | 13F/A | BlueCrest Capital Management Ltd | 0 | -100,00 | 0 | -100,00 | ||||
| 2026-02-09 | 13F | Morningstar Investment Management LLC | 95.863 | -43,87 | 3 | -60,00 | ||||
| 2026-02-12 | 13F | Marex Group plc | 247.859 | -7,14 | 7.114 | -23,82 | ||||
| 2026-02-13 | 13F | Panagora Asset Management Inc | 21.848 | -24,77 | 627 | -38,23 | ||||
| 2026-01-16 | 13F | Standard Life Aberdeen plc | 36.681 | -3,76 | 1.053 | -21,08 | ||||
| 2026-02-13 | 13F | Ieq Capital, Llc | 114.180 | -13,20 | 3.277 | -28,80 | ||||
| 2025-10-22 | 13F | Park Place Capital Corp | 0 | -100,00 | 0 | -100,00 | ||||
| 2025-11-14 | 13F | Victory Financial Group, Llc | 0 | -100,00 | 0 | |||||
| 2025-10-22 | 13F | SeaBridge Investment Advisors LLC | 0 | -100,00 | 0 | |||||
| 2026-02-09 | 13F | Advent Capital Management /de/ | Call | 0 | -100,00 | 0 | ||||
| 2026-02-10 | 13F | Goldman Sachs Group Inc | Put | 1.055.200 | -15,14 | 30.284 | -30,37 | |||
| 2026-02-11 | 13F | Mirae Asset Securities (usa) Inc. | 100.245 | 2.877 | ||||||
| 2026-02-13 | 13F | Golden State Wealth Management, LLC | 2.642 | 129,34 | 76 | 87,50 | ||||
| 2026-03-03 | 13F/A | Caitong International Asset Management Co., Ltd | 42 | -90,14 | 1 | -92,86 | ||||
| 2026-02-04 | 13F | Muhlenkamp & Co Inc | 0 | -100,00 | 0 | -100,00 | ||||
| 2026-01-26 | 13F | Cwm, Llc | 2.686 | 2,01 | 0 | |||||
| 2026-02-17 | 13F | Fmr Llc | 1.654.527 | -30,97 | 47.485 | -43,36 | ||||
| 2026-02-11 | 13F | Clearbridge Investments, LLC | 996.855 | -5,78 | 28.610 | -22,70 | ||||
| 2026-02-12 | 13F | Jane Street Group, Llc | Put | 5.011.400 | -0,78 | 143.827 | -18,59 | |||
| 2026-02-17 | 13F | Northern Trust Corp | 1.164.920 | -0,47 | 33.433 | -18,34 | ||||
| 2026-02-17 | 13F | Optiver Holding B.V. | 1.328.878 | 38.152 | ||||||
| 2026-02-12 | 13F | Jane Street Group, Llc | Call | 2.918.800 | -16,26 | 83.770 | -31,29 | |||
| 2026-01-21 | 13F | Aaron Wealth Advisors LLC | 9.012 | 35,93 | 259 | 11,69 | ||||
| 2026-02-12 | 13F | Jane Street Group, Llc | 3.680.127 | -20,99 | 105.620 | -35,18 | ||||
| 2025-10-27 | 13F | First Horizon Corp | 0 | -100,00 | 0 | |||||
| 2026-02-10 | 13F | Goldman Sachs Group Inc | 3.256.879 | -18,93 | 93.472 | -33,48 | ||||
| 2026-02-10 | 13F | Goldman Sachs Group Inc | Call | 1.693.600 | -35,67 | 48.606 | -47,22 | |||
| 2026-01-06 | 13F | Tucker Asset Management Llc | 0 | -100,00 | 0 | -100,00 | ||||
| 2026-02-12 | 13F | Wealthspire Advisors, LLC | 0 | -100,00 | 0 | |||||
| 2026-01-05 | 13F | Catherine Avery Investment Management LLC | 0 | -100,00 | 0 | |||||
| 2026-02-04 | 13F | Dogwood Wealth Management LLC | 51 | 0,00 | 1 | 0,00 | ||||
| 2026-02-17 | 13F | Cape Investment Advisory, Inc. | 200 | 6 | ||||||
| 2026-02-13 | 13F | Squarepoint Ops LLC | Call | 284.100 | 59,07 | 8.154 | 30,51 | |||
| 2026-02-13 | 13F | Squarepoint Ops LLC | Put | 1.504.500 | -47,23 | 43.179 | -56,70 | |||
| 2026-03-19 | 13F | Painted Porch Advisors LLC | 0 | -100,00 | 0 | |||||
| 2026-02-13 | 13F | SRS Capital Advisors, Inc. | 5.702 | 202,81 | 164 | 150,77 | ||||
| 2026-02-13 | 13F | Squarepoint Ops LLC | 1.237.039 | 17,30 | 35.503 | -3,76 | ||||
| 2026-02-02 | 13F | Fifth Third Bancorp | 10.703 | -6,87 | 307 | -23,44 | ||||
| 2026-02-12 | 13F | Banco BTG Pactual S.A. | 0 | -100,00 | 0 | |||||
| 2026-02-10 | 13F | Gw Henssler & Associates Ltd | 7.455 | 0,68 | 214 | -17,76 | ||||
| 2026-02-17 | 13F/A | RBF Capital, LLC | 50.000 | -16,67 | 1.435 | -31,60 | ||||
| 2025-11-14 | 13F | AXA Investment Managers S.A. | 867.324 | 93.204 | ||||||
| 2026-02-17 | 13F | Quantitative Investment Management, LLC | 0 | -100,00 | 0 | -100,00 | ||||
| 2025-11-12 | 13F | HAP Trading, LLC | Call | 207.700 | 419 | |||||
| 2026-02-13 | 13F | Natixis | 36.428 | 755,52 | 1.045 | 606,08 | ||||
| 2025-11-12 | 13F | HAP Trading, LLC | Put | 182.200 | 230 | |||||
| 2026-02-10 | 13F | Bnp Paribas | 13.304 | -83,74 | 382 | -86,72 | ||||
| 2025-11-12 | 13F | HAP Trading, LLC | 30.602 | 1.070 | ||||||
| 2026-01-30 | 13F | North Star Investment Management Corp. | 3.689 | 3,16 | 106 | -16,00 | ||||
| 2025-11-14 | 13F | Two Sigma Securities, Llc | 0 | -100,00 | 0 | -100,00 | ||||
| 2026-01-21 | 13F | Sound Income Strategies, LLC | 54 | 0,00 | 2 | 0,00 | ||||
| 2026-02-17 | 13F | Laird Norton Trust Company, Llc | 32.241 | 925 | ||||||
| 2025-10-23 | 13F | Park Avenue Securities Llc | 0 | -100,00 | 0 | |||||
| 2026-01-15 | 13F | Allspring Global Investments Holdings, LLC | 8.394 | 19,03 | 248 | -3,14 | ||||
| 2025-11-14 | 13F | Daiwa Securities Group Inc. | 0 | -100,00 | 0 | |||||
| 2026-01-27 | 13F | Zurcher Kantonalbank (Zurich Cantonalbank) | 45.621 | 78,68 | 1.309 | 46,58 | ||||
| 2026-01-05 | 13F | Union Bancaire Privee, UBP SA | 1.180 | 0,00 | 29 | -17,65 | ||||
| 2026-02-04 | 13F | Ameritas Advisory Services, LLC | 0 | -100,00 | 0 | |||||
| 2026-01-20 | 13F | Wall Street Access Asset Management, LLC | 150 | 0,00 | 4 | -20,00 | ||||
| 2026-02-05 | 13F | Baader Bank INC | 0 | -100,00 | 0 | |||||
| 2025-11-14 | 13F | Aspen Grove Capital, LLC | 0 | -100,00 | 0 | |||||
| 2026-01-29 | 13F | Matthews International Capital Management Llc | 0 | -100,00 | 0 | |||||
| 2026-02-17 | 13F | Maple Rock Capital Partners Inc. | 1.920.162 | -14,43 | 55.109 | -29,80 | ||||
| 2025-11-14 | 13F | Temasek Holdings (Private) Ltd | 0 | -100,00 | 0 | -100,00 | ||||
| 2026-02-13 | 13F | Barclays Plc | Call | 1.031.200 | 152,62 | 29.595 | 81,25 | |||
| 2026-02-13 | 13F | Barclays Plc | Put | 410.000 | -0,61 | 11.767 | -28,68 | |||
| 2026-02-13 | 13F | Barclays Plc | 1.060.572 | 36,35 | 30.438 | -2,17 | ||||
| 2026-02-13 | 13F | Sculptor Capital LP | Put | 8.500 | 0,00 | 244 | -18,18 | |||
| 2026-02-13 | 13F | Flow Traders U.s. Llc | 13.852 | 93,57 | 0 | |||||
| 2025-10-15 | 13F | Milestone Asset Management, Llc | 0 | -100,00 | 0 | -100,00 | ||||
| 2026-02-03 | 13F | Sequoia Financial Advisors, LLC | Call | 0 | -100,00 | 0 | -100,00 | |||
| 2026-02-20 | 13F/A | Capital Markets Trading UK LLP | Put | 471.600 | 19,67 | 14 | 0,00 | |||
| 2026-02-17 | 13F | Tudor Investment Corp Et Al | 59.676 | 1.713 | ||||||
| 2026-02-20 | 13F/A | Capital Markets Trading UK LLP | Call | 1.116.100 | -13,48 | 32 | -28,89 | |||
| 2025-11-13 | 13F | Limestone Investment Advisors LP | Put | 0 | -100,00 | 0 | -100,00 | |||
| 2026-02-13 | 13F | PCM Encore, LLC | 16.476 | 473 | ||||||
| 2026-02-17 | 13F | Tudor Investment Corp Et Al | Put | 257.100 | 2.471,00 | 7.379 | 2.014,04 | |||
| 2026-02-17 | 13F | Tudor Investment Corp Et Al | Call | 316.600 | 420,72 | 9.086 | 327,38 | |||
| 2026-02-13 | 13F | ICONIQ Capital, LLC | 7.462 | -34,55 | 214 | -46,23 | ||||
| 2026-01-09 | 13F | SG Americas Securities, LLC | 1.798.771 | 307,75 | 52 | 240,00 | ||||
| 2026-01-15 | 13F | Nisa Investment Advisors, Llc | 625 | 7,20 | 18 | -15,00 | ||||
| 2026-02-13 | 13F | Marshall Wace, Llp | Put | 0 | -100,00 | 0 | ||||
| 2026-02-10 | 13F | Acadian Asset Management Llc | 50.561 | -65,96 | 1 | -80,00 | ||||
| 2026-02-13 | 13F | Marshall Wace, Llp | Call | 0 | -100,00 | 0 | ||||
| 2026-02-13 | 13F | Marshall Wace, Llp | 0 | -100,00 | 0 | |||||
| 2026-02-13 | 13F | Verition Fund Management LLC | 139.386 | -34,07 | 4.000 | -45,91 | ||||
| 2026-02-13 | 13F | Verition Fund Management LLC | Put | 497.100 | 52,91 | 14.267 | 25,46 | |||
| 2026-03-04 | 13F | SHP Wealth Management | 56 | 2 | ||||||
| 2026-02-10 | 13F | SCS Capital Management LLC | 0 | -100,00 | 0 | |||||
| 2026-02-13 | 13F | Verition Fund Management LLC | Call | 175.200 | 8,96 | 5.028 | -10,60 | |||
| 2026-02-17 | 13F | Cantor Fitzgerald, L. P. | 0 | -100,00 | 0 | -100,00 | ||||
| 2026-02-17 | 13F | TCG Advisory Services, LLC | 0 | -100,00 | 0 | |||||
| 2026-02-09 | 13F | Arista Wealth Management, LLC | 0 | -100,00 | 0 | |||||
| 2025-11-12 | 13F | Quantbot Technologies LP | 0 | -100,00 | 0 | -100,00 | ||||
| 2026-01-22 | 13F | Financial Consulate, Inc | 33 | 725,00 | 1 | |||||
| 2026-02-17 | 13F | FIL Ltd | 8.539.000 | -7,59 | 245.069 | -24,18 | ||||
| 2026-01-23 | 13F | U.S. Capital Wealth Advisors, LLC | 83.093 | 381,31 | 2.385 | 295,36 | ||||
| 2026-02-17 | 13F | Point72 Asset Management, L.P. | Put | 591.100 | 5.752,48 | 16.965 | 4.705,67 | |||
| 2026-02-17 | 13F | Point72 Asset Management, L.P. | Call | 224.800 | -37,21 | 6.452 | -48,48 | |||
| 2026-02-11 | 13F | Allianz Asset Management GmbH | 160.000 | 0,00 | 4.592 | -17,94 | ||||
| 2026-02-17 | 13F | Dv Equities, Llc | 108.488 | 3.114 | ||||||
| 2026-02-17 | 13F | Point72 Asset Management, L.P. | 1.268.925 | -76,04 | 36.418 | -80,34 | ||||
| 2026-02-06 | 13F | HighTower Advisors, LLC | Put | 0 | -100,00 | 0 | -100,00 | |||
| 2026-02-11 | 13F | Nemes Rush Group LLC | 1.750 | 0,00 | 50 | -18,03 | ||||
| 2026-02-18 | 13F | VGI Partners Ltd | 0 | -100,00 | 0 | |||||
| 2025-11-13 | 13F | Canada Pension Plan Investment Board | 0 | -100,00 | 0 | |||||
| 2026-02-02 | 13F | JDM Financial Group LLC | 207 | 0,00 | 6 | -28,57 | ||||
| 2026-02-12 | 13F | Rossby Financial, LCC | 24 | 0,00 | 1 | |||||
| 2026-01-14 | 13F | Fluent Financial, LLC | 0 | -100,00 | 0 | |||||
| 2026-02-13 | 13F | DeepCurrents Investment Group LLC | Call | 0 | -100,00 | 0 | ||||
| 2026-01-20 | 13F | Ntv Asset Management Llc | 0 | -100,00 | 0 | |||||
| 2026-01-29 | 13F | Rakuten Securities, Inc. | 5.002 | -45,35 | 144 | -55,31 | ||||
| 2026-01-28 | 13F | Cortland Associates Inc/mo | 155.104 | -70,64 | 4.451 | -75,92 | ||||
| 2026-02-04 | 13F | Valeo Financial Advisors, LLC | 0 | -100,00 | 0 | |||||
| 2026-03-11 | 13F | Larry Mathis Financial Planning, LLC | 7.127 | 205 | ||||||
| 2026-02-13 | 13F | Vontobel Holding Ltd. | 141.601 | -44,90 | 4.064 | -54,81 | ||||
| 2026-02-17 | 13F | Bank Of America Corp /de/ | 2.985.391 | -54,05 | 85.681 | -62,30 | ||||
| 2026-01-27 | 13F | Financial Management Professionals, Inc. | 68 | -18,07 | 2 | -50,00 | ||||
| 2026-02-02 | 13F | AlphaStar Capital Management, LLC | 244.810 | 7.026 | ||||||
| 2026-02-13 | 13F | Vontobel Holding Ltd. | Call | 176.000 | 17,33 | 5.051 | -3,74 | |||
| 2026-02-13 | 13F | Y-Intercept (Hong Kong) Ltd | 0 | -100,00 | 0 | |||||
| 2026-02-04 | 13F | Clark Wealth Partners | 0 | -100,00 | 0 | |||||
| 2026-01-08 | 13F | Nordea Investment Management Ab | 643.383 | 3,62 | 18.391 | -15,05 | ||||
| 2026-02-04 | 13F | Valeo Financial Advisors, LLC | Call | 0 | -100,00 | 0 | ||||
| 2026-02-13 | 13F | Neuberger Berman Group LLC | 0 | -100,00 | 0 | |||||
| 2026-01-08 | 13F | Wealth Enhancement Advisory Services, Llc | 14.678 | -6,37 | 434 | -20,51 |