Basisstatistiken
| Institutionelle Aktien (Long) | 36.222.551 - 65,57% (ex 13D/G) - change of -5,69MM shares -13,57% MRQ |
| Institutioneller Wert (Long) | $ 820.397 USD ($1000) |
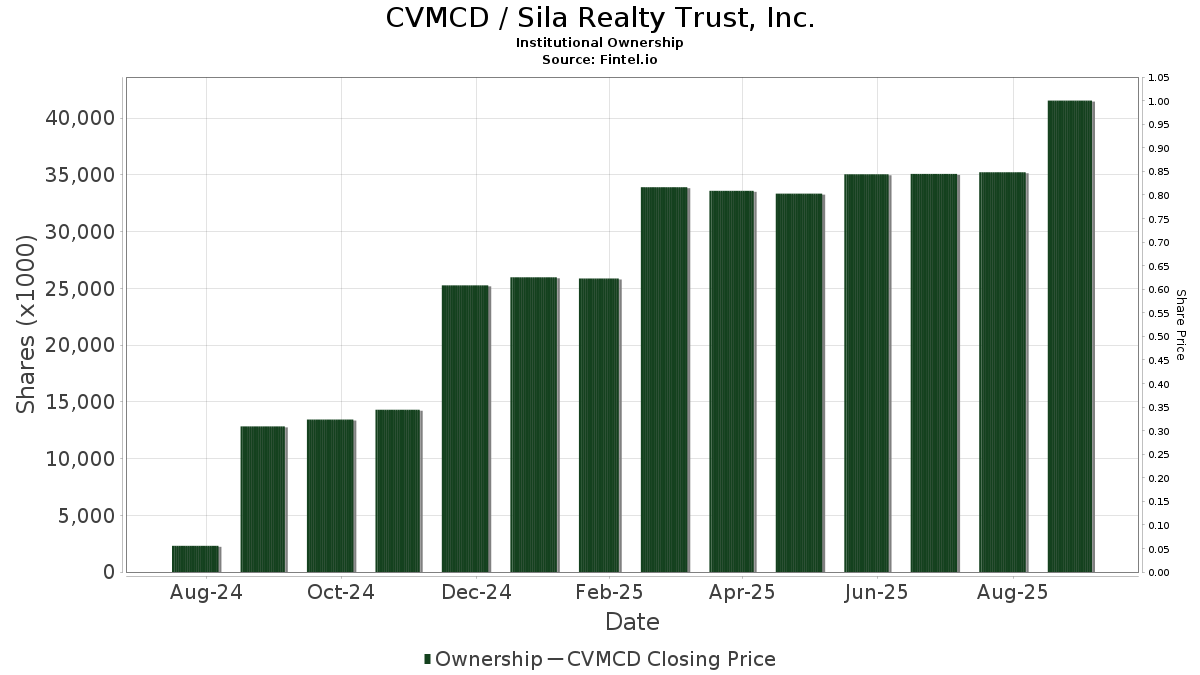
Institutioneller Eigentümerschaft und Aktionäre
Sila Realty Trust, Inc. (US:CVMCD) hat 276 institutionelle Eigentümer und Aktionäre, die 13D/G oder 13F Formulare bei der Securities Exchange Commission (SEC) eingereicht haben. Diese Institutionen halten insgesamt 36,222,551 Aktien. Die größten Aktionäre sind BlackRock, Inc., Vanguard Group Inc, State Street Corp, Frontier Capital Management Co Llc, Diameter Capital Partners LP, Geode Capital Management, Llc, Punch & Associates Investment Management, Inc., Charles Schwab Investment Management Inc, William Blair Investment Management, Llc, and Victory Capital Management Inc .
Sila Realty Trust, Inc. (OTCPK:CVMCD) Die institutionelle Eigentümerstruktur zeigt die aktuellen Positionen von Institutionen und Fonds im Unternehmen sowie die jüngsten Veränderungen der Positionsgröße. Zu den Großaktionären können Einzelanleger, Investmentfonds, Hedgefonds oder Institutionen gehören. Der Schedule 13D zeigt an, dass der Investor mehr als 5% des Unternehmens hält (oder gehalten hat) und beabsichtigt (oder beabsichtigt hat), aktiv eine Änderung der Geschäftsstrategie zu verfolgen. Schedule 13G zeigt eine passive Investition von über 5% an.
Fondsstimmung-Score
Der Fondsstimmung-Score (auch bekannt als Eigentümer-Akkumulations-Score) ermittelt die Aktien, die am meisten von Fonds gekauft werden. Er ist das Ergebnis eines ausgeklügelten quantitativen Multifaktormodells, das die Unternehmen mit den höchsten institutionellen Käufen identifiziert. Das Scoring-Modell verwendet eine Kombination aus der Gesamtzunahme der offengelegten Eigentümer, den Änderungen der Portfolioallokationen in diesen Eigentümern und anderen Metriken. Die Zahl reicht von 0 bis 100, wobei höhere Zahlen ein höheres Maß an Kapitalakkumulation als bei anderen Unternehmen anzeigen und 50 den Durchschnitt darstellt.
Aktualisierungshäufigkeit: Täglich
Siehe Ownership Explorer, der eine Liste der am höchsten bewerteten Unternehmen enthält.
AI+ Ask Fintel’s AI assistant about Sila Realty Trust, Inc..
Select a question to share a public post with an AI-crafted answer.
Thinking of good questions…
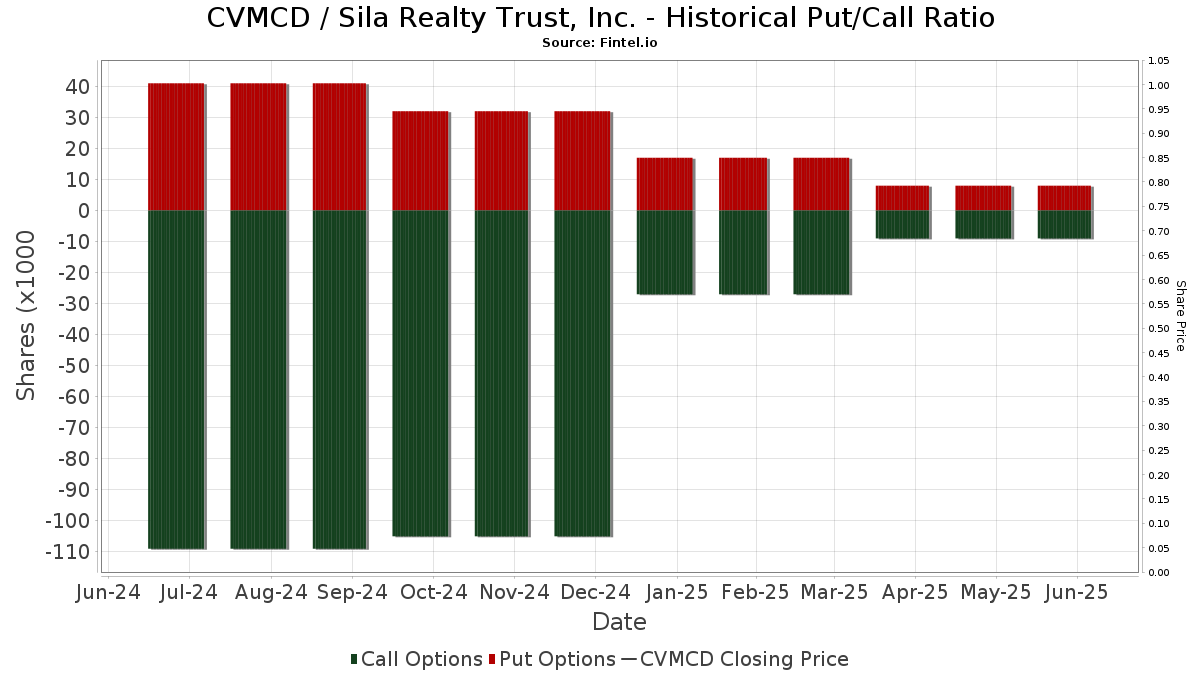
Institutionelles Put/Call-Verhältnis
Zusätzlich zur Meldung der Standardemissionen von Aktien und Schuldtiteln müssen Institute mit einem verwalteten Vermögen von mehr als 100 Mio. EUR auch ihre Bestände an Verkaufs- und Kaufoptionen offenlegen. Da Put-Optionen im Allgemeinen eine negative Stimmung und Call-Optionen eine positive Stimmung anzeigen, können wir uns ein Bild von der allgemeinen institutionellen Stimmung machen, indem wir das Verhältnis von Puts zu Calls aufzeichnen. Das Diagramm auf der rechten Seite zeigt das historische Put/Call-Verhältnis für dieses Instrument.
Die Verwendung des Put/Call-Verhältnisses als Indikator für die Anlegerstimmung überwindet einen der Hauptmängel der Verwendung des gesamten institutionellen Besitzes, der darin besteht, dass ein erheblicher Teil des verwalteten Vermögens passiv investiert wird, um Indizes abzubilden. Passiv verwaltete Fonds kaufen in der Regel keine Optionen, so dass der Indikator Put/Call-Verhältnis die Stimmung der aktiv verwalteten Fonds besser widerspiegelt.
13F und NPORT Einreichungen
Details zu 13F-Einreichungen sind kostenlos. Für Details zu NP-Einreichungen ist eine Premium-Mitgliedschaft erforderlich. Grüne Zeilen zeigen neue Positionen an. Rote Zeilen zeigen geschlossene Positionen an. Klicken Sie auf das Link Symbol, um den gesamten Transaktionsverlauf zu sehen.
Upgrade
um Prämiendaten freizuschalten und nach Excel zu exportieren ![]() .
.
| Datei Datum | Quelle | Anleger | Typ | Durchschnittlicher Preis (Est) |
Aktien | Δ Aktien (%) |
Gemeldeter Wert ($1000) |
Δ Wert (%) |
Port Alloc (%) |
|
|---|---|---|---|---|---|---|---|---|---|---|
| 2025-10-23 | 13F | Evolution Wealth Management Inc. | 0 | -100,00 | 0 | |||||
| 2025-11-13 | 13F | Arkhouse Management Co. LP | 20.640 | 0,00 | 518 | 6,15 | ||||
| 2026-02-06 | 13F | EverSource Wealth Advisors, LLC | 16 | -81,40 | 0 | -100,00 | ||||
| 2026-02-17 | 13F | Diameter Capital Partners LP | 1.750.000 | 24,84 | 40.792 | 15,94 | ||||
| 2026-01-29 | 13F | Pictet Asset Management Holding SA | 9.930 | 231 | ||||||
| 2026-01-30 | 13F | Us Bancorp \de\ | 8 | -91,21 | 0 | -100,00 | ||||
| 2026-02-13 | 13F | Parkside Financial Bank & Trust | 14.491 | 0,00 | 338 | -7,16 | ||||
| 2026-04-02 | 13F | Fulcrum Equity Management | 30.802 | 0,41 | 729 | 1,96 | ||||
| 2026-01-26 | 13F | Decker Retirement Planning Inc. | 113 | 0,00 | 3 | 0,00 | ||||
| 2026-02-17 | 13F | Adage Capital Partners Gp, L.l.c. | 771.571 | 33,47 | 17.985 | 23,95 | ||||
| 2026-02-09 | 13F | Investors Portfolio Services LLC | 274 | 6 | ||||||
| 2026-02-17 | 13F | Conversant Capital LLC | 0 | -100,00 | 0 | |||||
| 2026-01-12 | 13F | Castleview Partners, Llc | 25.841 | 5,47 | 602 | -1,95 | ||||
| 2026-04-14 | 13F | Moisand Fitzgerald Tamayo, LLC | 463 | 0,00 | 11 | 0,00 | ||||
| 2026-01-30 | 13F | Archer Investment Corp | 704 | 0,00 | 16 | -5,88 | ||||
| 2026-01-22 | 13F | Brookwood Investment Group LLC | 16.168 | 10,80 | 377 | 2,73 | ||||
| 2026-01-26 | 13F | PFG Investments, LLC | 64.017 | 52,38 | 1.492 | 41,56 | ||||
| 2026-02-14 | 13F | POM Investment Strategies, LLC | 836 | 0,00 | 19 | -5,00 | ||||
| 2026-02-17 | 13F | Jump Financial, LLC | 0 | -100,00 | 0 | |||||
| 2026-04-15 | 13F | Gf Fund Management Co. Ltd. | 834 | -8,95 | 20 | -9,52 | ||||
| 2025-11-14 | 13F | Brevan Howard Capital Management LP | 0 | -100,00 | 0 | |||||
| 2026-01-26 | 13F | Asset Dedication, LLC | 1.750 | 0,00 | 41 | -6,98 | ||||
| 2026-02-17 | 13F | California State Teachers Retirement System | 50.804 | -0,09 | 1.184 | -7,21 | ||||
| 2025-11-14 | 13F | Strategic Wealth Partners, Ltd. | 9.819 | 24,59 | 246 | 32,26 | ||||
| 2026-01-15 | 13F | Nisa Investment Advisors, Llc | 5.350 | -48,43 | 125 | -52,31 | ||||
| 2026-02-05 | 13F | Gamco Investors, Inc. Et Al | 23.152 | 6,47 | 540 | -1,10 | ||||
| 2026-02-05 | 13F | Amalgamated Bank | 1.749 | -8,00 | 0 | |||||
| 2026-04-13 | 13F | Gill Capital Partners, Llc | 1.006 | 24 | ||||||
| 2026-04-13 | 13F | Creative Financial Designs Inc /adv | 38.368 | -8,54 | 909 | -7,06 | ||||
| 2026-02-17 | 13F | Creative Planning | 15.274 | -25,75 | 356 | -31,01 | ||||
| 2026-02-13 | 13F | State Street Corp | 2.292.905 | -2,30 | 53.448 | -9,27 | ||||
| 2026-04-15 | 13F | Financial Management Professionals, Inc. | 197 | 0,00 | 5 | 0,00 | ||||
| 2026-02-13 | 13F | Integrated Wealth Concepts LLC | 0 | -100,00 | 0 | |||||
| 2026-02-17 | 13F | Man Group plc | 157.663 | 46,83 | 3.675 | 36,36 | ||||
| 2025-11-14 | 13F | Beacon Pointe Advisors, LLC | 0 | -100,00 | 0 | |||||
| 2026-02-13 | 13F | American Century Companies Inc | 24.525 | 1,49 | 572 | -5,78 | ||||
| 2026-02-13 | 13F | Sofos Investments, Inc. | 4.051 | -4,75 | 94 | -11,32 | ||||
| 2026-01-27 | 13F | PFG Advisors | 52.485 | -22,29 | 1.223 | -27,85 | ||||
| 2026-01-28 | 13F | Klp Kapitalforvaltning As | 11.800 | 11,32 | 275 | 3,38 | ||||
| 2026-02-12 | 13F | JPL Wealth Management, LLC | 0 | -100,00 | 0 | |||||
| 2026-02-17 | 13F | Cape Investment Advisory, Inc. | 5.076 | 118 | ||||||
| 2026-02-06 | 13F | McKinley Carter Wealth Services, Inc. | 13.980 | 0,00 | 326 | -7,14 | ||||
| 2026-02-10 | 13F | Goldman Sachs Group Inc | 283.020 | 32,61 | 6.597 | 23,17 | ||||
| 2026-01-13 | 13F | Synergy Financial Management, LLC | 12.948 | 302 | ||||||
| 2026-04-08 | 13F | Wealth Enhancement Advisory Services, Llc | 14.384 | -41,06 | 341 | -39,86 | ||||
| 2026-03-06 | 13F | Hsbc Holdings Plc | 92.404 | 23,62 | 2.154 | 14,77 | ||||
| 2026-01-06 | 13F | Tucker Asset Management Llc | 0 | -100,00 | 0 | |||||
| 2026-04-07 | 13F | CoreCap Advisors, LLC | 331 | 0,00 | 8 | 0,00 | ||||
| 2026-01-30 | 13F | Safe Harbor Family Capital, LLC | 9.095 | 212 | ||||||
| 2026-01-26 | 13F | Mirae Asset Global Investments Co., Ltd. | 1.613 | 33,53 | 38 | 23,33 | ||||
| 2026-02-13 | 13F | Sei Investments Co | 9.535 | 0,02 | 222 | -7,11 | ||||
| 2026-02-12 | 13F | New York State Common Retirement Fund | 17.600 | 0,00 | 410 | -7,03 | ||||
| 2025-11-04 | 13F | Guerra Advisors Inc | 383 | 10 | ||||||
| 2026-02-13 | 13F | MAI Capital Management | 585 | 0,00 | 14 | -7,14 | ||||
| 2026-02-17 | 13F | Aqr Capital Management Llc | 0 | -100,00 | 0 | |||||
| 2026-01-23 | 13F | State of Alaska, Department of Revenue | 32.281 | 19,62 | 1 | |||||
| 2026-01-16 | 13F | Standard Life Aberdeen plc | 19.947 | 1,33 | 465 | -4,92 | ||||
| 2026-01-23 | 13F | Diversify Advisory Services, LLC | 55.689 | 0,00 | 1.335 | 1,83 | ||||
| 2025-11-13 | 13F | Beaird Harris Wealth Management, LLC | 0 | -100,00 | 0 | |||||
| 2026-02-12 | 13F | Nuveen, LLC | 108.116 | 0,00 | 2.520 | -7,11 | ||||
| 2026-02-06 | 13F | Advisory Alpha, LLC | 10.324 | -7,44 | 241 | -12,41 | ||||
| 2026-02-06 | 13F | Covestor Ltd | 10 | 11,11 | 0 | |||||
| 2026-01-22 | 13F | Harwood Advisory Group, LLC | 630 | 0,00 | 15 | -6,67 | ||||
| 2026-01-29 | 13F | Vanguard Group Inc | 5.614.395 | 0,78 | 130.872 | -6,41 | ||||
| 2026-02-05 | 13F | Panoramic Investment Advisors, Llc | 10.250 | -8,86 | 239 | -15,60 | ||||
| 2026-02-11 | 13F | Allianz Asset Management GmbH | 210.487 | -36,23 | 4.906 | -40,78 | ||||
| 2026-02-13 | 13F | Brian Low Financial Group, Llc | 0 | -100,00 | 0 | |||||
| 2025-11-03 | 13F | Hutchens & Kramer Investment Management Group, LLC | 0 | -100,00 | 0 | |||||
| 2026-02-13 | 13F | Mariner, LLC | 139.686 | -4,13 | 3.256 | -10,97 | ||||
| 2026-04-15 | 13F | City Holding Co | 869 | 0,00 | 21 | 0,00 | ||||
| 2026-02-17 | 13F | Prelude Capital Management, Llc | 9.000 | 210 | ||||||
| 2026-02-11 | 13F | Parallel Advisors, LLC | 0 | -100,00 | 0 | |||||
| 2026-02-13 | 13F | Citigroup Inc | 64.094 | 29,75 | 1.494 | 20,58 | ||||
| 2026-02-26 | 13F | Anchor Investment Management, LLC | 5.777 | -0,64 | 135 | -7,59 | ||||
| 2026-02-13 | 13F | Arete Wealth Advisors, LLC | 27.493 | -4,76 | 1 | |||||
| 2025-10-29 | 13F | Inspire Advisors, LLC | 0 | -100,00 | 0 | |||||
| 2026-02-13 | 13F | Sterling Capital Management LLC | 3.209 | -16,76 | 75 | -22,92 | ||||
| 2026-02-17 | 13F | Bank Of America Corp /de/ | 82.584 | 103,14 | 1.925 | 88,73 | ||||
| 2026-02-17 | 13F | Atom Investors LP | 19.700 | 459 | ||||||
| 2026-02-10 | 13F | IAG Wealth Partners, LLC | 117 | 0,00 | 3 | 0,00 | ||||
| 2026-01-21 | 13F | Prime Capital Investment Advisors, LLC | 46.712 | -18,18 | 1.089 | -24,08 | ||||
| 2026-02-17 | 13F | MIRAE ASSET GLOBAL ETFS HOLDINGS Ltd. | 25.810 | -0,20 | 602 | -7,40 | ||||
| 2026-02-12 | 13F | BlackRock, Inc. | 5.712.181 | 1,27 | 133.151 | -5,96 | ||||
| 2026-02-17 | 13F | Price T Rowe Associates Inc /md/ | 33.193 | 11,81 | 1 | |||||
| 2026-02-06 | 13F | Larson Financial Group LLC | 55.379 | -10,42 | 1.291 | -16,83 | ||||
| 2026-02-02 | 13F | Cornerstone Planning Group LLC | 250 | 12.400,00 | 6 | |||||
| 2026-02-05 | 13F | Plante Moran Financial Advisors, LLC | 755 | 18 | ||||||
| 2025-11-04 | 13F | Independent Advisor Alliance | 0 | -100,00 | 0 | |||||
| 2026-02-10 | 13F | Bnp Paribas Arbitrage, Sa | 15.874 | -38,78 | 370 | -43,08 | ||||
| 2026-02-13 | 13F | Ubs Asset Management Americas Inc | 253.062 | -0,87 | 5.899 | -7,94 | ||||
| 2026-02-12 | 13F | Brinker Capital Investments, LLC | 35.117 | -9,49 | 819 | -15,93 | ||||
| 2026-02-02 | 13F | Mutual Advisors, LLC | 8.730 | 0,69 | 203 | -1,46 | ||||
| 2026-02-17 | 13F | Sophron Capital Management L.P. | 44.832 | 90,64 | 1.045 | 77,12 | ||||
| 2026-02-09 | 13F | Legal & General Group Plc | 262.089 | 5,98 | 6.109 | -1,58 | ||||
| 2026-02-17 | 13F | Citadel Advisors Llc | Call | 0 | -100,00 | 0 | ||||
| 2026-04-10 | 13F | Abound Wealth Management | 6.998 | 1,60 | 166 | 3,13 | ||||
| 2026-02-17 | 13F | Public Employees Retirement System Of Ohio | 76.315 | -2,84 | 1.779 | -9,79 | ||||
| 2026-04-16 | 13F | Brookstone Capital Management | 10.219 | -13,14 | 242 | -12,04 | ||||
| 2026-02-12 | 13F | Swiss National Bank | 108.781 | 2,06 | 2.536 | -5,23 | ||||
| 2026-02-10 | 13F/A | Northwestern Mutual Wealth Management Co | 4.415 | -24,77 | 103 | -30,61 | ||||
| 2026-02-11 | 13F | Cedar Mountain Advisors, LLC | 1.250 | 0,00 | 29 | -6,45 | ||||
| 2025-11-14 | 13F | Binnacle Investments Inc | 585 | 0,00 | 15 | 7,69 | ||||
| 2026-02-05 | 13F | Cambridge Investment Research Advisors, Inc. | 260.185 | -16,50 | 6 | -14,29 | ||||
| 2026-02-03 | 13F | Mitsubishi UFJ Kokusai Asset Management Co., Ltd. | 41.884 | 0,00 | 984 | -6,37 | ||||
| 2026-01-26 | 13F | Private Trust Co Na | 782 | 0,00 | 18 | -5,26 | ||||
| 2026-02-13 | 13F | Beacon Capital Management, LLC | 13.617 | -15,81 | 317 | -21,73 | ||||
| 2026-01-30 | 13F | State of New Jersey Common Pension Fund D | 27.000 | 0,00 | 629 | -7,09 | ||||
| 2026-02-11 | 13F | Los Angeles Capital Management Llc | 16.859 | 0,00 | 397 | -6,38 | ||||
| 2026-02-13 | 13F | Rhumbline Advisers | 75.382 | -14,47 | 1.757 | -20,57 | ||||
| 2026-04-17 | 13F | Stewardship Advisors, LLC | 11.489 | 0,00 | 272 | 1,87 | ||||
| 2026-01-27 | 13F | Zurcher Kantonalbank (Zurich Cantonalbank) | 29.820 | 0,00 | 695 | -7,09 | ||||
| 2026-04-15 | 13F | Fortitude Family Office, LLC | 22 | -99,89 | 1 | -100,00 | ||||
| 2026-01-28 | 13F | Universal- Beteiligungs- und Servicegesellschaft mbH | 9.168 | -89,97 | 214 | -90,71 | ||||
| 2026-04-15 | 13F | Exchange Traded Concepts, Llc | 740 | 23,54 | 18 | 30,77 | ||||
| 2026-01-15 | 13F | SILVER OAK SECURITIES, Inc | 2.117 | 1,53 | 49 | -5,77 | ||||
| 2026-02-17 | 13F | Northern Trust Corp | 565.409 | -6,45 | 13.180 | -13,12 | ||||
| 2026-04-14 | 13F | Madrona Financial Services, LLC | 170.762 | -1,88 | 4.044 | -0,32 | ||||
| 2026-02-11 | 13F | Simplex Trading, Llc | 639 | 320,39 | 15 | |||||
| 2026-02-12 | 13F | Federation des caisses Desjardins du Quebec | 4.425 | 26,79 | 103 | 18,39 | ||||
| 2026-04-10 | 13F | Octavia Wealth Advisors, LLC | 0 | -100,00 | 0 | |||||
| 2026-02-06 | 13F | ProShare Advisors LLC | 10.174 | 6,88 | 237 | -0,42 | ||||
| 2026-04-13 | 13F | St Germain D J Co Inc | 639 | 0,00 | 15 | 7,14 | ||||
| 2026-01-21 | 13F | Graham Capital Wealth Management, Llc | 0 | -100,00 | 0 | |||||
| 2026-01-20 | 13F | Harbor Capital Advisors, Inc. | 128.297 | -6,53 | 3 | -33,33 | ||||
| 2026-01-28 | 13F | Financial Perspectives, Inc | 0 | -100,00 | 0 | |||||
| 2026-02-13 | 13F | Van Eck Associates Corp | 14.872 | 9,83 | 0 | |||||
| 2026-02-17 | 13F | Jones Financial Companies Lllp | 4.092 | 157,04 | 95 | 143,59 | ||||
| 2026-04-08 | 13F | BOS Asset Management, LLC | 22.510 | 0,00 | 533 | 1,72 | ||||
| 2026-02-10 | 13F | Nomura Asset Management Co Ltd | 83.780 | 3,71 | 1.953 | -3,70 | ||||
| 2026-02-06 | 13F | Kingdom Financial Group LLC. | 560 | 13 | ||||||
| 2026-01-23 | 13F | Sage Mountain Advisors LLC | 0 | -100,00 | 0 | |||||
| 2026-02-13 | 13F | Mml Investors Services, Llc | 14.471 | -2,73 | 337 | -9,65 | ||||
| 2025-11-04 | 13F | Gitterman Wealth Management, LLC | 0 | -100,00 | 0 | |||||
| 2026-02-12 | 13F | Concorde Asset Management, LLC | 8.840 | -17,69 | 206 | -21,97 | ||||
| 2026-02-11 | 13F | Metis Global Partners, LLC | 13.041 | 4,86 | 304 | -2,88 | ||||
| 2026-02-17 | 13F | Cambria Investment Management, L.P. | 24.302 | 0,03 | 566 | -7,06 | ||||
| 2026-01-30 | 13F | Sigma Planning Corp | 16.198 | -3,80 | 378 | -10,66 | ||||
| 2026-02-11 | 13F | J.w. Cole Advisors, Inc. | 13.467 | -34,19 | 175 | -65,89 | ||||
| 2025-10-20 | 13F | Virginia Retirement Systems Et Al | 0 | -100,00 | 0 | |||||
| 2026-02-12 | 13F | Chilton Capital Management Llc | 322.726 | -14,75 | 7.523 | -20,84 | ||||
| 2026-02-13 | 13F | Centaurus Financial, Inc. | 38.202 | -5,51 | 1 | -100,00 | ||||
| 2026-02-17 | 13F | Citadel Advisors Llc | 511.350 | 1.003,93 | 11.920 | 925,73 | ||||
| 2025-11-12 | 13F | CIBC Bancorp USA Inc. | 10.196 | 256 | ||||||
| 2026-02-17 | 13F | Citadel Advisors Llc | Put | 14.200 | 77,50 | 331 | 65,50 | |||
| 2026-04-14 | 13F | Focus Financial Network, Inc. | 9.363 | -16,90 | 222 | -15,65 | ||||
| 2026-01-21 | 13F | Raleigh Capital Management Inc. | 1.653 | 0,00 | 39 | -7,32 | ||||
| 2026-02-03 | 13F | Strategic Wealth Advisors LLC | 2.157 | 0 | ||||||
| 2026-02-13 | 13F | Victory Capital Management Inc | 832.683 | -15,63 | 19.410 | -21,65 | ||||
| 2026-02-17 | 13F | Cetera Investment Advisers | 207.405 | -1,36 | 4.835 | -8,39 | ||||
| 2026-02-18 | 13F | Mackenzie Financial Corp | 19.490 | 8,74 | 453 | 0,89 | ||||
| 2026-02-03 | 13F | International Assets Investment Management, Llc | 4.957 | 116 | ||||||
| 2025-11-14 | 13F | Quarry LP | 0 | -100,00 | 0 | |||||
| 2026-02-13 | 13F | Kestra Advisory Services, LLC | 0 | -100,00 | 0 | |||||
| 2026-02-13 | 13F | Macquarie Group Ltd | 29.849 | -12,51 | 696 | -18,81 | ||||
| 2026-04-01 | 13F | Pensionfund Sabic | 29.000 | 45,00 | 1 | |||||
| 2026-02-11 | 13F | Jpmorgan Chase & Co | 170.519 | -22,93 | 3.975 | -28,44 | ||||
| 2026-02-12 | 13F | Triumph Capital Management | 12.321 | -10,03 | 287 | -16,33 | ||||
| 2026-02-17 | 13F | Advisor Group Holdings, Inc. | 269.821 | -27,19 | 6.290 | -32,02 | ||||
| 2026-02-05 | 13F | Allworth Financial LP | 23.008 | -14,13 | 536 | -20,24 | ||||
| 2026-01-26 | 13F | Cwm, Llc | 15.915 | -22,34 | 0 | |||||
| 2026-02-17 | 13F | Qube Research & Technologies Ltd | 44.495 | 1.037 | ||||||
| 2026-02-17 | 13F | Amundi | 32.372 | 13,37 | 755 | 10,40 | ||||
| 2026-02-10 | 13F | Intech Investment Management Llc | 21.326 | 16,86 | 497 | 8,52 | ||||
| 2026-02-13 | 13F | LGT Financial Advisors LLC | 5.336 | 0,00 | 124 | -6,77 | ||||
| 2026-01-22 | 13F | Bartlett & Co. Wealth Management Llc | 643 | 0,00 | 15 | -12,50 | ||||
| 2026-02-04 | 13F | HighPoint Advisor Group LLC | 17.347 | 2,43 | 404 | -4,94 | ||||
| 2026-02-04 | 13F | Midwest Trust Co | 10.828 | 0,00 | 252 | -7,01 | ||||
| 2026-02-17 | 13F | Punch & Associates Investment Management, Inc. | 1.255.395 | 10,57 | 29.263 | 2,68 | ||||
| 2026-02-13 | 13F | Caitong International Asset Management Co., Ltd | 0 | -100,00 | 0 | |||||
| 2026-02-17 | 13F | Captrust Financial Advisors | 0 | -100,00 | 0 | |||||
| 2026-04-07 | 13F | Farther Finance Advisors, LLC | 14.760 | 11,84 | 351 | 14,01 | ||||
| 2026-02-09 | 13F | Quest Partners LLC | 413 | 10 | ||||||
| 2026-02-17 | 13F | SummitTX Capital, L.P. | 102.600 | 17,48 | 2.392 | 9,08 | ||||
| 2026-01-12 | 13F | Private Wealth Group, LLC | 0 | -100,00 | 0 | |||||
| 2026-02-09 | 13F | Keating Financial Advisory Services, Inc. | 394 | 9 | ||||||
| 2025-11-14 | 13F | Susquehanna International Group, Llp | Call | 0 | -100,00 | 0 | -100,00 | |||
| 2026-02-19 | 13F | Invesco Ltd. | 417.622 | 111,91 | 9.735 | 96,81 | ||||
| 2025-11-04 | 13F | State of Wyoming | 0 | -100,00 | 0 | |||||
| 2026-02-12 | 13F | Voya Investment Management Llc | 10.347 | -1,32 | 241 | -8,37 | ||||
| 2026-02-03 | 13F | Legacy Wealth Managment, LLC/ID | 828 | 0,00 | 19 | -5,00 | ||||
| 2026-02-13 | 13F | Morgan Stanley | 156.343 | 42,77 | 3.644 | 32,61 | ||||
| 2025-11-14 | 13F | Tudor Investment Corp Et Al | 0 | -100,00 | 0 | |||||
| 2026-04-08 | 13F | DiNuzzo Private Wealth, Inc. | 735 | 0,00 | 17 | 0,00 | ||||
| 2026-01-14 | 13F | Spire Wealth Management | 5.276 | -77,39 | 123 | -79,15 | ||||
| 2026-02-12 | 13F | Wealthspire Advisors, LLC | 0 | -100,00 | 0 | |||||
| 2025-11-12 | 13F | Transce3nd, LLC | 0 | -100,00 | 0 | |||||
| 2026-02-12 | 13F | Alps Advisors Inc | 9.549 | 223 | ||||||
| 2026-01-23 | 13F/A | HF Advisory Group, LLC | 23.597 | -6,51 | 550 | -13,11 | ||||
| 2026-02-11 | 13F | LPL Financial LLC | 271.063 | -17,22 | 6.318 | -23,13 | ||||
| 2026-02-17 | 13F | Abel Hall, LLC | 10.059 | -50,01 | 234 | -53,66 | ||||
| 2026-02-13 | 13F | Charles Schwab Investment Management Inc | 1.003.144 | 3,40 | 23.383 | -3,98 | ||||
| 2026-02-17 | 13F | Coppell Advisory Solutions LLC | 11.665 | -0,53 | 272 | -6,55 | ||||
| 2026-02-10 | 13F | Daiwa Securities Group Inc. | 20.496 | 2,65 | 0 | |||||
| 2026-01-28 | 13F | Geneos Wealth Management Inc. | 42.109 | -3,88 | 982 | -10,74 | ||||
| 2026-02-17 | 13F | Prosperity Bancshares Inc | 960 | 22 | ||||||
| 2026-02-09 | 13F | Harbour Investments, Inc. | 20.242 | -63,94 | 472 | -66,55 | ||||
| 2026-02-09 | 13F | William Blair Investment Management, Llc | 980.180 | -9,42 | 22.848 | -15,88 | ||||
| 2026-02-13 | 13F | Police & Firemen's Retirement System of New Jersey | 15.427 | 0,19 | 360 | -6,99 | ||||
| 2026-02-13 | 13F | A4 Wealth Advisors LLC | 18.746 | -32,89 | 437 | -37,80 | ||||
| 2026-02-13 | 13F | Change Path, LLC | 16.692 | 11,04 | 389 | 3,18 | ||||
| 2026-02-17 | 13F | Bridgeway Capital Management Inc | 41.100 | -8,26 | 958 | -14,77 | ||||
| 2026-01-28 | 13F | WPG Advisers, LLC | 5.916 | -96,02 | 138 | -96,32 | ||||
| 2026-01-21 | 13F | Newbridge Financial Services Group, Inc. | 1.130 | -8,28 | 26 | -13,33 | ||||
| 2026-02-18 | 13F | GWM Advisors LLC | 0 | -100,00 | 0 | |||||
| 2025-11-12 | 13F | Picton Mahoney Asset Management | 0 | -100,00 | 0 | -100,00 | ||||
| 2026-04-01 | 13F | Pensionfund DSM Netherlands | 60.000 | 46,34 | 1 | |||||
| 2026-02-13 | 13F | Segall Bryant & Hamill, Llc | 43.442 | -0,40 | 1.013 | -7,50 | ||||
| 2025-10-31 | 13F | Y-Intercept (Hong Kong) Ltd | 0 | -100,00 | 0 | |||||
| 2026-02-04 | 13F | LRI Investments, LLC | 1.437 | 0,00 | 33 | -8,33 | ||||
| 2026-02-17 | 13F | State Of Wisconsin Investment Board | 32.035 | -10,62 | 747 | -17,02 | ||||
| 2026-02-13 | 13F | Manufacturers Life Insurance Company, The | 0 | -100,00 | 0 | |||||
| 2026-01-26 | 13F | AE Wealth Management LLC | 28.213 | 6,53 | 658 | -1,05 | ||||
| 2026-02-11 | 13F | Ameritas Investment Partners, Inc. | 4.651 | 108 | ||||||
| 2026-01-21 | 13F | Sound Income Strategies, LLC | 1.778 | -44,25 | 43 | -44,00 | ||||
| 2026-02-02 | 13F | Principal Financial Group Inc | 61.353 | 42,52 | 1.430 | 32,41 | ||||
| 2026-02-10 | 13F | Seven Springs Wealth Group, LLC | 0 | -100,00 | 0 | |||||
| 2026-02-02 | 13F | Strs Ohio | 10.100 | 0,00 | 235 | -7,11 | ||||
| 2026-02-13 | 13F | Safeguard Investment Advisory Group, LLC | 10.683 | 1,01 | 249 | -6,04 | ||||
| 2026-01-16 | 13F | Ronald Blue Trust, Inc. | 8.371 | 0,00 | 195 | -7,14 | ||||
| 2026-02-13 | 13F | BNP Paribas Asset Management Holding S.A. | 14.396 | 942,43 | 0 | |||||
| 2026-02-12 | 13F | Commonwealth Equity Services, Llc | 72.894 | -22,94 | 1.699 | 84.850,00 | ||||
| 2026-02-13 | 13F | Huber Capital Management LLC | 29.668 | -64,11 | 692 | -66,68 | ||||
| 2026-01-23 | 13F | Sumitomo Mitsui Trust Holdings, Inc. | 60.894 | -1,45 | 1.419 | -8,45 | ||||
| 2026-02-11 | 13F | MCF Advisors LLC | 419 | 0,00 | 10 | -10,00 | ||||
| 2026-02-17 | 13F | Lazard Asset Management Llc | 38.702 | -25,86 | 902 | -31,15 | ||||
| 2026-02-17 | 13F | Frontier Capital Management Co Llc | 2.284.365 | -12,89 | 53.249 | -19,11 | ||||
| 2026-02-13 | 13F | Ausdal Financial Partners, Inc. | 18.118 | -52,01 | 422 | -55,44 | ||||
| 2026-04-17 | 13F | Vermillion Wealth Management, Inc. | 221 | 1,84 | 5 | 0,00 | ||||
| 2026-02-17 | 13F | Ameriprise Financial Inc | 377.154 | 334,19 | 8.791 | 303,26 | ||||
| 2026-02-12 | 13F | SWAN Capital LLC | 280 | 0,00 | 7 | -14,29 | ||||
| 2026-02-17 | 13F | Cresset Asset Management, LLC | 17.884 | 0,00 | 417 | -7,14 | ||||
| 2026-02-12 | 13F | Quadrant Capital Group Llc | 0 | -100,00 | 0 | |||||
| 2026-02-06 | 13F | Entrust Financial Llc | 1.225 | 29 | ||||||
| 2026-02-05 | 13F | Thrivent Financial For Lutherans | 338.759 | 57,19 | 8 | 40,00 | ||||
| 2026-02-04 | 13F | Tsfg, Llc | 2.561 | 0,00 | 0 | |||||
| 2026-02-11 | 13F | Deutsche Bank Ag\ | 72.484 | 7,23 | 1.690 | -0,41 | ||||
| 2026-02-17 | 13F | Russell Investments Group, Ltd. | 10.730 | 36,36 | 250 | 26,90 | ||||
| 2026-02-17 | 13F | Warren Averett Asset Management, LLC | 0 | -100,00 | 0 | |||||
| 2026-01-29 | 13F | Dunhill Financial, LLC | 2 | 0 | ||||||
| 2026-02-17 | 13F | Royal Bank Of Canada | 72.446 | -20,54 | 1.689 | -26,21 | ||||
| 2026-02-17 | 13F | Ameriflex Group, Inc. | 9.122 | 10,22 | 213 | 2,42 | ||||
| 2025-11-04 | 13F | Oakworth Capital, Inc. | 0 | -100,00 | 0 | |||||
| 2026-01-15 | 13F | Warwick Investment Management, Inc. | 0 | -100,00 | 0 | |||||
| 2026-02-06 | 13F | HighTower Advisors, LLC | 35.406 | 7,00 | 825 | -0,60 | ||||
| 2026-02-13 | 13F | Golden State Wealth Management, LLC | 1.071 | 87,57 | 25 | 71,43 | ||||
| 2026-02-17 | 13F | Second Line Capital, LLC | 0 | -100,00 | 0 | |||||
| 2026-02-17 | 13F | Susquehanna Fundamental Investments, Llc | 0 | -100,00 | 0 | |||||
| 2026-01-29 | 13F | UBS Group AG | 230.703 | 15,29 | 5.378 | 7,07 | ||||
| 2026-02-17 | 13F | Two Sigma Investments, Lp | 20.900 | -16,40 | 487 | -22,33 | ||||
| 2026-02-10 | 13F | Basepoint Wealth LLC | 1.269 | 30 | ||||||
| 2026-02-10 | 13F | Rothschild Investment Llc | 16 | -60,00 | 0 | -100,00 | ||||
| 2026-01-29 | 13F | Huntleigh Advisors, Inc. | 44.245 | -4,05 | 1.031 | -10,89 | ||||
| 2026-02-13 | 13F | Wells Fargo & Company/mn | 65.199 | 43,41 | 1.520 | 33,13 | ||||
| 2026-03-04 | 13F | Rehmann Capital Advisory Group | 20.547 | -4,34 | 479 | -11,32 | ||||
| 2026-01-14 | 13F | MeadowBrook Investment Advisors LLC | 7.425 | -35,16 | 173 | -39,72 | ||||
| 2026-02-11 | 13F | Group One Trading, L.p. | 100 | 2 | ||||||
| 2026-02-17 | 13F | Advisory Services Network, LLC | 9.212 | -0,20 | 215 | -7,36 | ||||
| 2026-02-02 | 13F | CENTRAL TRUST Co | 0 | -100,00 | 0 | |||||
| 2026-01-28 | 13F | Arizona State Retirement System | 15.451 | -5,32 | 360 | -11,98 | ||||
| 2026-02-13 | 13F | Verition Fund Management LLC | 31.700 | 1,07 | 739 | -6,23 | ||||
| 2026-02-09 | 13F | Geode Capital Management, Llc | 1.529.888 | -0,07 | 35.666 | -7,19 | ||||
| 2026-04-17 | 13F | Krilogy Financial LLC | 17.765 | -0,30 | 449 | 5,40 | ||||
| 2026-03-13 | 13F/A | Pensionmark Financial Group, Llc | 20.668 | 482 | ||||||
| 2026-04-15 | 13F | Silverlake Wealth Management Llc | 17.796 | -0,19 | 421 | 1,45 | ||||
| 2026-02-10 | 13F | Commonwealth Of Pennsylvania Public School Empls Retrmt Sys | 18.066 | 0,00 | 421 | -7,06 | ||||
| 2026-01-26 | 13F | KBC Group NV | 1.759 | 0,00 | 0 | |||||
| 2026-02-17 | 13F | Two Sigma Advisers, Lp | 38.300 | -44,57 | 893 | -48,56 | ||||
| 2026-04-15 | 13F | Merit Financial Group, LLC | 25.329 | 0,66 | 600 | 2,22 | ||||
| 2026-02-06 | 13F | Bare Financial Services, Inc | 2.057 | 0,00 | 48 | -7,84 | ||||
| 2026-02-11 | 13F | Vestcor Inc | 0 | -100,00 | 0 | |||||
| 2026-02-12 | 13F | M&G Plc | 9.995 | 230 | ||||||
| 2026-02-17 | 13F | Alliancebernstein L.p. | 66.867 | 0,69 | 1.559 | -6,48 | ||||
| 2026-01-23 | 13F | Assetmark, Inc | 30 | -93,39 | 1 | -100,00 | ||||
| 2026-02-06 | 13F | Aew Capital Management L P | 1.800 | 42 | ||||||
| 2025-10-31 | 13F | Global Assets Advisory, LLC | 0 | -100,00 | 0 | |||||
| 2026-04-06 | 13F | CX Institutional | 351 | 0 | ||||||
| 2026-01-14 | 13F | ORG Wealth Partners, LLC | 3.014 | 0,13 | 70 | -6,67 | ||||
| 2026-02-13 | 13F | SRS Capital Advisors, Inc. | 341 | -66,54 | 8 | -72,00 | ||||
| 2026-02-17 | 13F | Janus Henderson Group Plc | 23.800 | 0,00 | 555 | -7,20 | ||||
| 2026-02-13 | 13F | Barclays Plc | 89.045 | 10,47 | 2.076 | 2,57 | ||||
| 2026-02-12 | 13F | Jane Street Group, Llc | 29.688 | -24,67 | 692 | -30,03 | ||||
| 2026-02-06 | 13F | Resona Asset Management Co.,Ltd. | 22.964 | -6,02 | 535 | -11,72 | ||||
| 2026-01-13 | 13F/A | Sanctuary Advisors, LLC | 10.558 | -13,89 | 265 | -8,62 | ||||
| 2026-02-10 | 13F | Bank of New York Mellon Corp | 293.678 | 51,19 | 6.846 | 40,41 | ||||
| 2026-02-03 | 13F | Sumitomo Mitsui DS Asset Management Company, Ltd | 13.336 | 0,00 | 311 | -7,19 | ||||
| 2026-02-12 | 13F | IFM Investors Pty Ltd | 0 | -100,00 | 0 | |||||
| 2026-01-21 | 13F | Capital Investment Advisory Services, LLC | 10.648 | -19,38 | 248 | -25,08 | ||||
| 2026-01-21 | 13F | Flagship Harbor Advisors, Llc | 997 | 23 | ||||||
| 2026-02-17 | 13F | Nissay Asset Management Corp /japan/ /adv | 8.887 | 3,93 | 207 | -3,27 | ||||
| 2026-02-02 | 13F | Eq Wealth Advisors, Llc | 419 | 10 | ||||||
| 2026-02-09 | 13F | Avalon Trust Co | 1.763 | 0,00 | 41 | -6,82 | ||||
| 2026-02-12 | 13F | MetLife Investment Management, LLC | 33.068 | -5,81 | 771 | -12,60 | ||||
| 2026-04-14 | 13F | Nbc Securities, Inc. | 1.728 | 0,00 | 41 | 0,00 | ||||
| 2026-02-10 | 13F | Quantbot Technologies LP | 13.500 | -59,30 | 315 | -62,26 | ||||
| 2026-04-17 | 13F | AdvisorNet Financial, Inc | 184 | 1,66 | 4 | 0,00 | ||||
| 2026-02-10 | 13F | Envestnet Asset Management Inc | 162.918 | -31,07 | 3.798 | -35,99 | ||||
| 2026-02-11 | 13F | United Financial Planning Group LLC | 1.380 | 0,00 | 32 | -5,88 | ||||
| 2026-02-13 | 13F | Colony Group, LLC | 40.364 | 11,61 | 941 | 3,64 | ||||
| 2026-02-02 | 13F | Mcdonald Partners Llc | 42.910 | -4,23 | 1.000 | -11,03 | ||||
| 2026-01-08 | 13F | Chesapeake Asset Management Llc | 99 | 0,00 | 2 | 0,00 | ||||
| 2026-04-07 | 13F | Signaturefd, Llc | 40 | 0,00 | 1 | |||||
| 2026-02-17 | 13F | Raymond James Financial Inc | 28.792 | -32,17 | 671 | -37,00 | ||||
| 2026-02-12 | 13F | Rossby Financial, LCC | 480 | -88,28 | 11 | -89,22 | ||||
| 2026-02-17 | 13F | Tower Research Capital LLC (TRC) | 2.293 | -26,34 | 53 | -32,05 | ||||
| 2026-02-17 | 13F | Susquehanna International Group, Llp | 51.384 | 2,72 | 1.198 | -4,62 | ||||
| 2026-02-17 | 13F | Aster Capital Management (DIFC) Ltd | 226 | 5 | ||||||
| 2026-02-12 | 13F | CIBC Private Wealth Group, LLC | 2.000 | 0,00 | 47 | -8,00 | ||||
| 2026-04-06 | 13F | GAMMA Investing LLC | 161 | 89,41 | 4 | 200,00 | ||||
| 2026-02-03 | 13F | Diversify Wealth Management, Llc | 85.419 | -4,98 | 2.045 | -3,36 | ||||
| 2026-02-09 | 13F | Integrity Alliance, Llc. | 10.503 | 245 | ||||||
| 2026-01-05 | 13F | Park Avenue Securities Llc | 0 | -100,00 | 0 | |||||
| 2026-01-14 | 13F | Accurate Wealth Management, LLC | 12.567 | -9,22 | 293 | -10,94 | ||||
| 2026-02-20 | 13F | Sunbelt Securities, Inc. | 822 | 1,61 | 19 | -5,00 | ||||
| 2026-02-06 | 13F | Global Retirement Partners, LLC | 3.460 | 0,20 | 81 | -6,98 | ||||
| 2026-02-12 | 13F | Dimensional Fund Advisors Lp | 549.392 | 5,30 | 12.806 | -2,20 | ||||
| 2026-04-13 | 13F | IFP Advisors, Inc | 1.819 | 0,00 | 43 | 2,38 | ||||
| 2026-04-16 | 13F | SG Americas Securities, LLC | 12.049 | -22,34 | 0 | |||||
| 2025-11-14 | 13F | Mount Yale Investment Advisors, LLC | 0 | -100,00 | 0 | -100,00 | ||||
| 2026-02-13 | 13F | Dynamic Technology Lab Private Ltd | 0 | -100,00 | 0 | |||||
| 2026-02-17 | 13F | Millennium Management Llc | 749.944 | 14,64 | 17.481 | 6,47 | ||||
| 2026-02-17 | 13F | Fmr Llc | 779 | -42,38 | 18 | -45,45 | ||||
| 2026-02-13 | 13F | Aptus Capital Advisors, LLC | 0 | -100,00 | 0 | |||||
| 2026-01-29 | 13F | UMA Financial Services, Inc. | 0 | -100,00 | 0 | |||||
| 2026-01-27 | 13F | Asset Management One Co., Ltd. | 122.041 | 7,21 | 2.845 | -0,46 | ||||
| 2025-11-04 | 13F | Pineridge Advisors LLC | 10.812 | 1,59 | 271 | 7,97 | ||||
| 2026-02-05 | 13F | Gabelli Funds Llc | 128.876 | 3,31 | 3.004 | -4,06 | ||||
| 2026-02-12 | 13F | UniSuper Management Pty Ltd | 11.100 | -31,06 | 259 | -36,14 | ||||
| 2026-02-17 | 13F | SageView Advisory Group, LLC | 250 | 6 | ||||||
| 2026-02-11 | 13F | Cerity Partners LLC | 52.693 | 15,92 | 1.228 | 7,72 | ||||
| 2025-11-12 | 13F | First Trust Advisors Lp | 0 | -100,00 | 0 |