Basisstatistiken
| Institutionelle Eigentümer | 1167 total, 1159 long only, 2 short only, 6 long/short - change of -31,44% MRQ |
| Durchschnittliche Portfolioallokation | 0.2184 % - change of -29,04% MRQ |
| Institutionelle Aktien (Long) | 82.761.469 (ex 13D/G) - change of -9,20MM shares -9,97% MRQ |
| Institutioneller Wert (Long) | $ 20.011.750 USD ($1000) |
Institutioneller Eigentümerschaft und Aktionäre
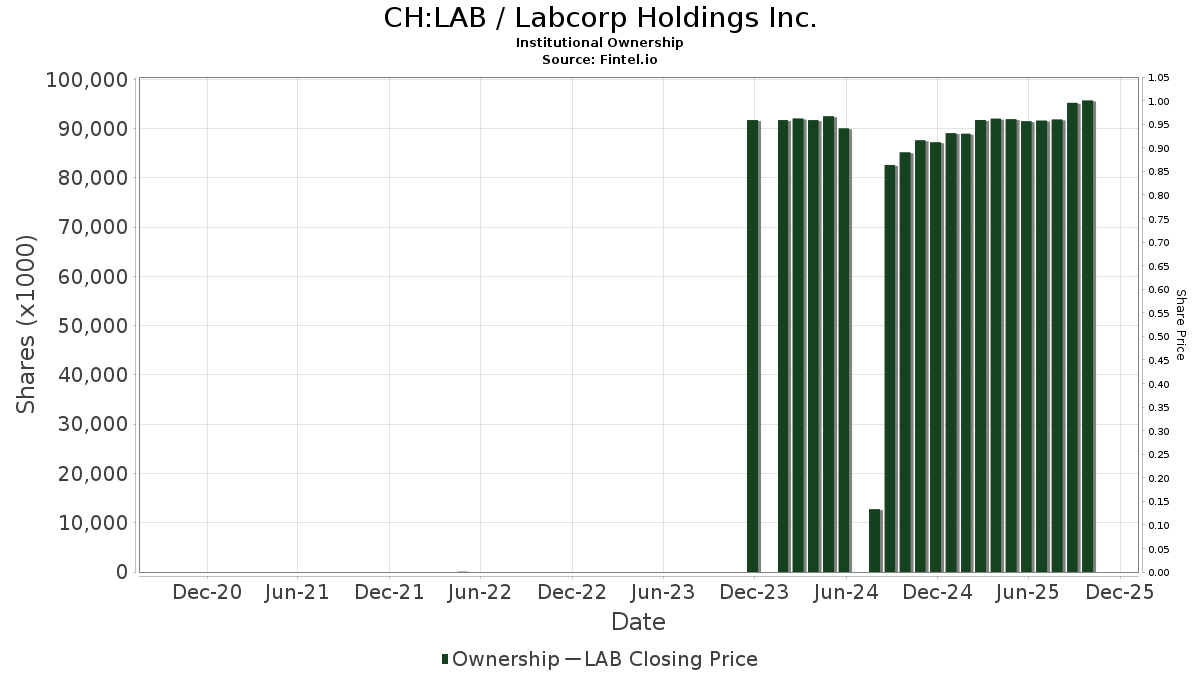
Labcorp Holdings Inc. (CH:LAB) hat 1167 institutionelle Eigentümer und Aktionäre, die 13D/G oder 13F Formulare bei der Securities Exchange Commission (SEC) eingereicht haben. Diese Institutionen halten insgesamt 82,774,693 Aktien. Die größten Aktionäre sind Vanguard Group Inc, BlackRock, Inc., Victory Capital Management Inc, State Street Corp, Allspring Global Investments Holdings, LLC, Geode Capital Management, Llc, Select Equity Group, L.P., Wellington Management Group Llp, Boston Partners, and Morgan Stanley .
Labcorp Holdings Inc. (BRSE:LAB) Die institutionelle Eigentümerstruktur zeigt die aktuellen Positionen von Institutionen und Fonds im Unternehmen sowie die jüngsten Veränderungen der Positionsgröße. Zu den Großaktionären können Einzelanleger, Investmentfonds, Hedgefonds oder Institutionen gehören. Der Schedule 13D zeigt an, dass der Investor mehr als 5% des Unternehmens hält (oder gehalten hat) und beabsichtigt (oder beabsichtigt hat), aktiv eine Änderung der Geschäftsstrategie zu verfolgen. Schedule 13G zeigt eine passive Investition von über 5% an.
Fondsstimmung-Score
Der Fondsstimmung-Score (auch bekannt als Eigentümer-Akkumulations-Score) ermittelt die Aktien, die am meisten von Fonds gekauft werden. Er ist das Ergebnis eines ausgeklügelten quantitativen Multifaktormodells, das die Unternehmen mit den höchsten institutionellen Käufen identifiziert. Das Scoring-Modell verwendet eine Kombination aus der Gesamtzunahme der offengelegten Eigentümer, den Änderungen der Portfolioallokationen in diesen Eigentümern und anderen Metriken. Die Zahl reicht von 0 bis 100, wobei höhere Zahlen ein höheres Maß an Kapitalakkumulation als bei anderen Unternehmen anzeigen und 50 den Durchschnitt darstellt.
Aktualisierungshäufigkeit: Täglich
Siehe Ownership Explorer, der eine Liste der am höchsten bewerteten Unternehmen enthält.
AI+ Ask Fintel’s AI assistant about Labcorp Holdings Inc..
Select a question to share a public post with an AI-crafted answer.
Thinking of good questions…
13F und NPORT Einreichungen
Details zu 13F-Einreichungen sind kostenlos. Für Details zu NP-Einreichungen ist eine Premium-Mitgliedschaft erforderlich. Grüne Zeilen zeigen neue Positionen an. Rote Zeilen zeigen geschlossene Positionen an. Klicken Sie auf das Link Symbol, um den gesamten Transaktionsverlauf zu sehen.
Upgrade
um Prämiendaten freizuschalten und nach Excel zu exportieren ![]() .
.
Important Note
In an effort to reduce load times for our mobile users, we are testing some ways to deliver lighter pages.
In this first test, we will deliver only the most recent 750 transactions (out of 1355 for this stock). If you are interested in loading *all* the transactions for this company, click the "load all" button below. This is just a test and if you don't like it, please let us know by submitting some gentle feedback via the link at the bottom of this page.
Load All| Datei Datum | Quelle | Anleger | Typ | Durchschnittlicher Preis (Est) |
Aktien | Δ Aktien (%) |
Gemeldeter Wert ($1000) |
Δ Wert (%) |
Port Alloc (%) |
|
|---|---|---|---|---|---|---|---|---|---|---|
| 2026-02-05 | 13F | Cambridge Investment Research Advisors, Inc. | 11.076 | 6,16 | 3 | 0,00 | ||||
| 2026-02-12 | 13F | Skandinaviska Enskilda Banken AB (publ) | 16.265 | -27,58 | 4.081 | -36,70 | ||||
| 2026-02-17 | 13F | Captrust Financial Advisors | 35.227 | 5,91 | 8.838 | -7,44 | ||||
| 2026-02-05 | 13F | Td Private Client Wealth Llc | 1.687 | -25,72 | 423 | -35,02 | ||||
| 2026-02-13 | 13F | Candriam Luxembourg S.C.A. | 11.205 | -75,99 | 2.811 | -79,01 | ||||
| 2025-09-25 | NP | ILCB - iShares Morningstar Large-Cap ETF | 1.640 | 1,30 | 427 | 9,23 | ||||
| 2026-01-15 | 13F | Retirement Systems of Alabama | 17.637 | -0,51 | 4.425 | -13,05 | ||||
| 2026-01-21 | 13F | Oak Thistle LLC | 6.848 | 1.718 | ||||||
| 2026-02-02 | 13F | Equitable Trust Co | 75.658 | -1,01 | 18.981 | -13,48 | ||||
| 2026-02-04 | 13F | Swiss Life Asset Management Ltd | 18.713 | -49,46 | 4.695 | -55,84 | ||||
| 2026-02-13 | 13F | Charles Schwab Investment Management Inc | 640.559 | -1,60 | 160.703 | -14,00 | ||||
| 2025-09-25 | NP | DFVEX - U.s. Vector Equity Portfolio - Institutional Class This fund is a listed as child fund of Dimensional Fund Advisors Lp and if that institution has disclosed ownership in this security, then these positions will not be double counted when calculating total shares and total value | 13.055 | 73,65 | 3.395 | 87,47 | ||||
| 2026-02-03 | 13F | Bokf, Na | 10.909 | -4,35 | 2.737 | -16,41 | ||||
| 2026-01-13 | 13F | Parsons Capital Management Inc/ri | 2.274 | 0,00 | 571 | -12,58 | ||||
| 2026-02-17 | 13F | NEOS Investment Management LLC | 2.750 | 0,40 | 690 | -12,34 | ||||
| 2026-01-23 | 13F | Carnegie Capital Asset Management, LLC | 1.239 | -24,41 | 311 | -34,04 | ||||
| 2026-02-11 | 13F | Ing Groep Nv | 969 | 243 | ||||||
| 2026-01-23 | 13F | Private Wealth Management Group, LLC | 47 | -2,08 | 12 | -15,38 | ||||
| 2025-09-26 | NP | ETLGX - E*TRADE No Fee Large Cap Index Fund | 52 | 271,43 | 14 | 333,33 | ||||
| 2026-02-03 | 13F | Coston, McIsaac & Partners | 28 | 0,00 | 0 | |||||
| 2026-02-11 | 13F | WESCAP Management Group, Inc. | 1.735 | -11,70 | 435 | -22,87 | ||||
| 2025-09-29 | NP | SEG Partners Long/Short Equity Fund | 25.892 | -14,81 | 6.734 | -8,08 | ||||
| 2026-02-06 | 13F | Insight Inv LLC | 3.914 | -1,01 | 982 | -13,57 | ||||
| 2026-02-09 | 13F | Fisher Asset Management, LLC | 1.754 | 1,39 | 440 | -11,29 | ||||
| 2025-09-25 | NP | JVAL - JPMorgan U.S. Value Factor ETF | 3.357 | -9,49 | 873 | -2,24 | ||||
| 2026-02-24 | 13F | Bell Investment Advisors, Inc | 17 | -10,53 | 4 | -20,00 | ||||
| 2026-01-16 | 13F | Ronald Blue Trust, Inc. | 333 | -44,50 | 84 | -51,74 | ||||
| 2026-02-17 | 13F | EFG International AG | 132 | 33 | ||||||
| 2025-11-14 | 13F | Strategic Wealth Partners, Ltd. | 106 | 0,00 | 30 | 11,11 | ||||
| 2026-01-07 | 13F | Aventura Private Wealth, LLC | 1 | 0 | ||||||
| 2026-01-27 | 13F | Regions Financial Corp | 17.470 | -6,40 | 4.383 | -18,20 | ||||
| 2025-11-14 | 13F | Wetherby Asset Management Inc | 1.148 | 5,51 | 330 | 15,44 | ||||
| 2026-02-17 | 13F | Warren Averett Asset Management, LLC | 3.678 | 12,86 | 923 | -1,39 | ||||
| 2026-01-14 | 13F | Eastern Bank | 15 | 4 | ||||||
| 2026-02-13 | 13F | Williams Jones Wealth Management, LLC. | 3.410 | 0,00 | 856 | -12,58 | ||||
| 2026-02-13 | 13F | Martin & Co Inc /tn/ | 20.708 | 3,28 | 5.195 | -9,73 | ||||
| 2026-02-17 | 13F | Gotham Asset Management, LLC | 161.681 | 70,14 | 40.563 | 48,69 | ||||
| 2025-09-26 | NP | FIOOX - Fidelity Series Large Cap Value Index Fund This fund is a listed as child fund of Fmr Llc and if that institution has disclosed ownership in this security, then these positions will not be double counted when calculating total shares and total value | 28.031 | -2,97 | 7.290 | 4,71 | ||||
| 2026-02-04 | 13F | First Foundation Advisors | 14.615 | -9,40 | 3.667 | -20,82 | ||||
| 2026-02-17 | 13F | Graham Capital Management, L.P. | 0 | -100,00 | 0 | |||||
| 2025-11-14 | 13F | Occudo Quantitative Strategies Lp | 0 | -100,00 | 0 | |||||
| 2026-01-28 | 13F | Klp Kapitalforvaltning As | 29.513 | 0,00 | 7.404 | -12,61 | ||||
| 2025-09-25 | NP | ITHAX - THE HARTFORD CAPITAL APPRECIATION FUND Class A | 88.742 | 23.080 | ||||||
| 2026-01-23 | 13F | Halbert Hargrove Global Advisors, Llc | 0 | -100,00 | 0 | |||||
| 2026-02-17 | 13F | Canada Pension Plan Investment Board | 14.810 | 278,77 | 3.716 | 231,11 | ||||
| 2025-11-07 | 13F | Synovus Financial Corp | 1.423 | -0,14 | 408 | 9,09 | ||||
| 2026-01-23 | 13F | Ritholtz Wealth Management | 1.541 | -30,02 | 387 | -38,92 | ||||
| 2026-02-03 | 13F | NewEdge Wealth, LLC | 966 | 242 | ||||||
| 2025-11-14 | 13F | Binnacle Investments Inc | 3 | -82,35 | 1 | -100,00 | ||||
| 2026-02-13 | 13F | Rafferty Asset Management, LLC | 8.925 | -3,26 | 2.239 | -15,45 | ||||
| 2026-02-09 | 13F | Investors Portfolio Services LLC | 3 | 1 | ||||||
| 2026-02-09 | 13F | MTM Investment Management, LLC | 30 | 0,00 | 8 | -12,50 | ||||
| 2026-02-10 | 13F | Baker Avenue Asset Management, LP | 880 | 221 | ||||||
| 2026-02-12 | 13F | JPL Wealth Management, LLC | 0 | -100,00 | 0 | |||||
| 2026-02-12 | 13F | South Dakota Investment Council | 5.518 | 0,00 | 1 | 0,00 | ||||
| 2026-02-12 | 13F | Federated Hermes, Inc. | 517 | 43,21 | 130 | 25,24 | ||||
| 2026-01-14 | 13F | Romano Brothers And Company | 13.613 | 0,00 | 3.415 | -12,59 | ||||
| 2026-01-20 | 13F | AdvisorNet Financial, Inc | 8 | 0,00 | 2 | 0,00 | ||||
| 2026-01-29 | 13F | LFA - Lugano Financial Advisors SA | 27 | 0,00 | 7 | -14,29 | ||||
| 2025-09-29 | NP | PBP - Invesco S&P 500 BuyWrite ETF This fund is a listed as child fund of Invesco Ltd. and if that institution has disclosed ownership in this security, then these positions will not be double counted when calculating total shares and total value | 447 | 77,38 | 116 | 93,33 | ||||
| 2026-01-05 | 13F | GoalVest Advisory LLC | 33 | 8 | ||||||
| 2026-01-30 | 13F | Folger Nolan Fleming Douglas Capital Management, Inc | 1.687 | -3,98 | 423 | -16,07 | ||||
| 2026-02-09 | 13F | Cooke & Bieler Lp | 752.916 | -0,20 | 188.892 | -12,78 | ||||
| 2026-01-08 | 13F | Brave Asset Management Inc | 995 | 0,00 | 250 | -12,63 | ||||
| 2026-02-12 | 13F | Jane Street Group, Llc | Call | 15.100 | -24,50 | 3.788 | -34,02 | |||
| 2026-02-12 | 13F | Jane Street Group, Llc | 7.525 | -92,01 | 1.888 | -93,02 | ||||
| 2026-02-13 | 13F | Mill Creek Capital Advisors, LLC | 0 | -100,00 | 0 | |||||
| 2026-01-14 | 13F | Tradewinds Capital Management, LLC | 170 | 0,00 | 43 | -12,50 | ||||
| 2026-01-22 | 13F | WealthBridge Investment Counsel Inc. | 34.856 | 0,32 | 9 | -11,11 | ||||
| 2026-02-11 | 13F | Prudential Plc | 1.781 | 0,00 | 447 | -12,72 | ||||
| 2026-02-12 | 13F | Jane Street Group, Llc | Put | 19.500 | -15,95 | 4.892 | -26,54 | |||
| 2026-02-17 | 13F | Sherbrooke Park Advisers Llc | 0 | -100,00 | 0 | |||||
| 2025-09-29 | NP | PTLC - Pacer Trendpilot US Large Cap ETF | 5.184 | -10,87 | 1.348 | -7,16 | ||||
| 2026-02-13 | 13F | Johnson Investment Counsel Inc | 0 | -100,00 | 0 | |||||
| 2026-03-04 | 13F | Rehmann Capital Advisory Group | 3.230 | 0,16 | 812 | -12,51 | ||||
| 2026-01-28 | 13F | Mowery & Schoenfeld Wealth Management, LLC | 16 | 60,00 | 4 | 100,00 | ||||
| 2026-01-30 | 13F | Oakworth Capital, Inc. | 223 | 13,20 | 56 | -1,79 | ||||
| 2026-01-15 | 13F | Highline Wealth Partners Llc | 7 | 0,00 | 2 | -50,00 | ||||
| 2026-01-21 | 13F | Sound Income Strategies, LLC | 12 | 3 | ||||||
| 2026-02-17 | 13F | Jones Financial Companies Lllp | 6.405 | 32,75 | 1.607 | 18,61 | ||||
| 2026-02-06 | 13F | Twin Capital Management Inc | 2.349 | -0,17 | 589 | -12,74 | ||||
| 2026-01-22 | 13F | Investment Advisory Services Inc /tx /adv | 3.180 | -0,69 | 798 | -13,28 | ||||
| 2026-01-21 | 13F | Capital Advisors, Ltd. LLC | 38 | 0,00 | 0 | |||||
| 2026-02-13 | 13F | Resources Management Corp /ct/ /adv | 770 | 0,00 | 0 | |||||
| 2026-02-11 | 13F | Franklin Resources Inc | 21.083 | -31,24 | 5.289 | -39,90 | ||||
| 2026-01-22 | 13F | V-Square Quantitative Management LLC | 2.378 | 597 | ||||||
| 2026-02-13 | 13F | Blueshift Asset Management, LLC | 2.203 | -69,84 | 553 | -73,66 | ||||
| 2026-02-17 | 13F | Nomura Holdings Inc | 914 | -57,29 | 229 | -62,70 | ||||
| 2026-01-22 | 13F | Evermay Wealth Management Llc | 3.295 | -12,81 | 827 | -23,80 | ||||
| 2026-01-29 | 13F | Concord Wealth Partners | 0 | -100,00 | 0 | |||||
| 2025-09-29 | NP | XYLD - Global X S&P 500 Covered Call ETF This fund is a listed as child fund of Mirae Asset Global Investments Co., Ltd. and if that institution has disclosed ownership in this security, then these positions will not be double counted when calculating total shares and total value | 5.111 | -2,61 | 1.329 | 5,14 | ||||
| 2026-01-16 | 13F | Tempus Wealth Planning, LLC | 2.359 | 0,86 | 592 | -11,92 | ||||
| 2026-02-10 | 13F | Westpac Banking Corp | 10.237 | -40,85 | 2.568 | -48,30 | ||||
| 2026-02-17 | 13F | Riverview Capital Advisers, LLC | 6.905 | 0,00 | 1.732 | -12,61 | ||||
| 2026-01-29 | 13F | Resonant Capital Advisors, LLC | 3.773 | 3,80 | 947 | -9,30 | ||||
| 2026-01-30 | 13F | Activest Wealth Management | 0 | -100,00 | 0 | |||||
| 2026-02-13 | 13F | Acumen Wealth Advisors, LLC | 92 | 23 | ||||||
| 2026-02-12 | 13F | California Public Employees Retirement System | 213.446 | -14,03 | 53.549 | -24,86 | ||||
| 2026-02-10 | 13F | Goldman Sachs Group Inc | 595.463 | 41,06 | 149.390 | 23,28 | ||||
| 2026-01-12 | 13F | Beacon Financial Strategies CORP | 130 | 33 | ||||||
| 2026-01-23 | 13F | LOM Asset Management Ltd | 3.784 | -0,68 | 949 | -13,25 | ||||
| 2026-02-17 | 13F | Wiley Bros.-aintree Capital, Llc | 10.199 | 13,15 | 2.557 | -1,20 | ||||
| 2026-01-08 | 13F | Ulland Investment Advisors, LLC | 1.043 | 0,00 | 0 | |||||
| 2026-01-28 | 13F | Old National Bancorp /in/ | 847 | -7,73 | 212 | -19,39 | ||||
| 2026-02-03 | 13F | Gateway Investment Advisers Llc | 2.852 | -2,89 | 716 | -15,18 | ||||
| 2026-01-29 | 13F | UBS Group AG | Put | 0 | -100,00 | 0 | -100,00 | |||
| 2026-02-17 | 13F | Wellington Management Group Llp | 1.963.101 | -6,78 | 492.503 | -18,53 | ||||
| 2026-02-02 | 13F | Bay Harbor Wealth Management, LLC | 16 | 33,33 | 4 | 33,33 | ||||
| 2026-01-20 | 13F | Sheets Smith Wealth Management | 1.642 | 0,31 | 412 | -12,55 | ||||
| 2026-01-23 | 13F | Farther Finance Advisors, LLC | 2.573 | 3,17 | 646 | -9,92 | ||||
| 2026-02-10 | 13F | Nomura Asset Management Co Ltd | 27.677 | -0,83 | 6.944 | -13,33 | ||||
| 2026-02-10 | 13F | REAP Financial Group, LLC | 218 | 20,44 | 55 | 5,88 | ||||
| 2025-09-25 | NP | DFEOX - U.s. Core Equity 1 Portfolio - Institutional Class This fund is a listed as child fund of Dimensional Fund Advisors Lp and if that institution has disclosed ownership in this security, then these positions will not be double counted when calculating total shares and total value | 92.172 | 0,00 | 23.972 | 7,91 | ||||
| 2026-02-02 | 13F | Essex Savings Bank | 1.143 | -6,69 | 287 | -18,52 | ||||
| 2026-02-11 | 13F | Bradley & Co. Private Wealth Management, LLC | 80 | 0,00 | 20 | -9,09 | ||||
| 2026-02-13 | 13F | Squarepoint Ops LLC | Put | 0 | -100,00 | 0 | -100,00 | |||
| 2026-02-10 | 13F | Eurizon Capital SGR S.p.A. | 69.188 | 17.361 | ||||||
| 2026-01-21 | 13F | Hunter Associates Investment Management Llc | 16.705 | -0,80 | 4 | 0,00 | ||||
| 2026-01-26 | 13F | PFG Investments, LLC | 1.236 | 19,77 | 310 | 4,73 | ||||
| 2026-02-17 | 13F | Norinchukin Bank, The | 5.054 | 6,78 | 1.268 | -6,70 | ||||
| 2026-02-10 | 13F | Holderness Investments Co | 4.164 | 0,00 | 1.045 | -12,64 | ||||
| 2026-02-12 | 13F | Principal Securities, Inc. | 7.100 | 17,41 | 1.781 | 2,65 | ||||
| 2026-01-21 | 13F | Country Trust Bank | 13 | 0,00 | 3 | 0,00 | ||||
| 2026-02-13 | 13F | Morgan Stanley | 1.505.539 | -0,12 | 377.710 | -12,71 | ||||
| 2026-02-17 | 13F | Osterweis Capital Management Inc | 76.063 | -2,67 | 19.083 | -14,94 | ||||
| 2026-02-12 | 13F | Raiffeisen Bank International AG | 2.886 | -5,93 | 730 | -15,80 | ||||
| 2026-02-13 | 13F | 8 Knots Management, Llc | 0 | -100,00 | 0 | |||||
| 2025-09-25 | NP | WELLS FARGO MASTER TRUST - Wells Fargo Real Return Portfolio Real Return Portfolio | 3.053 | 0,00 | 794 | 8,03 | ||||
| 2026-01-23 | 13F | Ami Asset Management Corp | 178.762 | -2,20 | 44.848 | -14,52 | ||||
| 2026-01-28 | 13F | WPG Advisers, LLC | 5 | 0,00 | 1 | 0,00 | ||||
| 2026-01-12 | 13F | Heartwood Wealth Advisors LLC | 0 | -100,00 | 0 | -100,00 | ||||
| 2026-01-27 | 13F | Old Second National Bank Of Aurora | 50 | 0,00 | 13 | -14,29 | ||||
| 2026-02-10 | 13F | Womack Financial LLC | 1.255 | 0,00 | 315 | -12,78 | ||||
| 2026-02-17 | 13F | Oxford Asset Management Llp | 1.530 | 384 | ||||||
| 2026-01-07 | 13F | Hilltop National Bank | 236 | -75,92 | 59 | -79,00 | ||||
| 2026-02-05 | 13F | Commerzbank Aktiengesellschaft /fi | 920 | 0,00 | 0 | |||||
| 2026-01-21 | 13F | First United Bank Trust/ | 20 | 0,00 | 5 | 0,00 | ||||
| 2026-02-02 | 13F | Qrg Capital Management, Inc. | 3.340 | 9,19 | 838 | -4,56 | ||||
| 2025-09-26 | NP | MSTQX - Morningstar U.S. Equity Fund | 8.541 | -18,42 | 2.221 | -11,97 | ||||
| 2026-02-17 | 13F | Advisory Services Network, LLC | 5.397 | -4,60 | 1.354 | -16,57 | ||||
| 2026-02-10 | 13F | BKD Wealth Advisors, LLC | 8.083 | -1,26 | 2.028 | -13,71 | ||||
| 2026-02-13 | 13F | Prudential Financial Inc | 52.591 | -5,86 | 13.194 | -17,72 | ||||
| 2026-02-13 | 13F | Public Sector Pension Investment Board | 0 | -100,00 | 0 | |||||
| 2026-02-02 | 13F | CX Institutional | 1.017 | 4,31 | 0 | |||||
| 2026-02-12 | 13F | Index Technologies Group LLC | 2.887 | 724 | ||||||
| 2026-02-06 | 13F | Profund Advisors Llc | 1.348 | 25,86 | 338 | 10,10 | ||||
| 2026-02-09 | 13F | MQS Management LLC | 931 | 234 | ||||||
| 2026-01-29 | 13F | Camelot Portfolios, LLC | 1.326 | -6,16 | 333 | -18,02 | ||||
| 2025-11-14 | 13F | Millennium Management Llc | Call | 0 | -100,00 | 0 | -100,00 | |||
| 2026-02-13 | 13F | Arkadios Wealth Advisors | 2.113 | -10,77 | 530 | -21,94 | ||||
| 2025-09-26 | NP | FITLX - Fidelity U.S. Sustainability Index Fund This fund is a listed as child fund of Fmr Llc and if that institution has disclosed ownership in this security, then these positions will not be double counted when calculating total shares and total value | 13.277 | 0,00 | 3.453 | 7,94 | ||||
| 2026-01-27 | 13F | 55 North Private Wealth, LLC | 819 | 205 | ||||||
| 2026-01-22 | 13F | Kennebec Savings Bank | 146 | 0,00 | 37 | -12,20 | ||||
| 2026-01-21 | 13F | Greenleaf Trust | 4.372 | -1,91 | 1.097 | -14,31 | ||||
| 2026-02-17 | 13F | Ws Management Lllp | 105.000 | 0,00 | 26.342 | -12,60 | ||||
| 2026-02-17 | 13F | Claro Advisors LLC | 0 | -100,00 | 0 | |||||
| 2026-01-23 | 13F | Westside Investment Management, Inc. | 47 | 0,00 | 12 | -15,38 | ||||
| 2026-02-11 | 13F | Meeder Asset Management Inc | 25 | -3,85 | 6 | -14,29 | ||||
| 2026-01-09 | 13F | Somerset Trust Co | 861 | 6,03 | 216 | -7,30 | ||||
| 2026-01-14 | 13F | Exchange Traded Concepts, Llc | 1.147 | -8,82 | 288 | -20,50 | ||||
| 2026-02-13 | 13F | Cornerstone Financial Management LLC | 6 | 2 | ||||||
| 2026-02-11 | 13F | O'shaughnessy Asset Management, Llc | 10.324 | -84,77 | 2.590 | -86,69 | ||||
| 2025-11-07 | 13F | Beacon Capital Management, LLC | 0 | -100,00 | 0 | |||||
| 2026-02-04 | 13F | Tsfg, Llc | 0 | -100,00 | 0 | |||||
| 2026-02-10 | 13F | Argent Trust Co | 4.206 | -1,45 | 1.055 | -13,88 | ||||
| 2026-01-28 | 13F | Universal- Beteiligungs- und Servicegesellschaft mbH | 95.349 | -17,47 | 24.010 | -27,61 | ||||
| 2026-01-16 | 13F | Tema Etfs Llc | 1.755 | -0,23 | 440 | -12,70 | ||||
| 2026-02-11 | 13F | Boston Research & Management Inc | 23.543 | -2,48 | 6 | -16,67 | ||||
| 2026-01-21 | 13F | Baker Ellis Asset Management LLC | 7.005 | -4,11 | 1.757 | -16,17 | ||||
| 2026-02-17 | 13F | Clear Street Markets Llc | 122 | -15,86 | 31 | -26,83 | ||||
| 2026-02-17 | 13F | Farringdon Capital, Ltd. | 0 | -100,00 | 0 | |||||
| 2026-01-21 | 13F | Albion Financial Group /ut | 6 | 0,00 | 2 | 0,00 | ||||
| 2026-01-28 | 13F | Marietta Wealth Management, LLC | 32.012 | 5,99 | 8.031 | -7,37 | ||||
| 2026-02-13 | 13F | Prosight Management, LP | 34.532 | 8.663 | ||||||
| 2026-02-03 | 13F | Cheviot Value Management, LLC | 0 | -100,00 | 0 | |||||
| 2026-01-29 | 13F | Comerica Bank | 32.175 | 13,38 | 8.072 | -0,91 | ||||
| 2026-02-13 | 13F | Polymer Capital Management (HK) LTD | 0 | -100,00 | 0 | |||||
| 2025-09-25 | NP | DFQTX - U.s. Core Equity 2 Portfolio - Institutional Class This fund is a listed as child fund of Dimensional Fund Advisors Lp and if that institution has disclosed ownership in this security, then these positions will not be double counted when calculating total shares and total value | 86.550 | 0,00 | 22.510 | 7,91 | ||||
| 2026-01-30 | 13F | Exencial Wealth Advisors, Llc | 8.160 | -1,91 | 2.047 | -14,28 | ||||
| 2026-02-12 | 13F | Lansforsakringar Fondforvaltning AB (publ) | 27.970 | 0,81 | 7.017 | -11,89 | ||||
| 2026-02-13 | 13F | Parkside Financial Bank & Trust | 539 | 4,05 | 135 | -8,78 | ||||
| 2025-09-26 | NP | LVPIX - Large-cap Value Profund Investor Class | 16 | -96,52 | 4 | -96,36 | ||||
| 2026-02-13 | 13F | Public Employees Retirement Association Of Colorado | 7.829 | 0,00 | 2 | -50,00 | ||||
| 2026-02-17 | 13F | Glenmede Trust Co Na | 266.230 | -5,88 | 66.792 | 1,46 | ||||
| 2026-01-30 | 13F | Archer Investment Corp | 4.127 | -4,62 | 1.035 | -16,67 | ||||
| 2026-02-10 | 13F | Axq Capital, Lp | 1.366 | 343 | ||||||
| 2026-01-12 | 13F | Contravisory Investment Management, Inc. | 35.803 | -3,05 | 8.982 | -15,27 | ||||
| 2026-02-10 | 13F | Peapack Gladstone Financial Corp | 88.391 | 1,70 | 22 | -8,33 | ||||
| 2025-11-14 | 13F | Axa S.a. | 0 | -100,00 | 0 | -100,00 | ||||
| 2026-02-13 | 13F | Towarzystwo Funduszy Inwestycyjnych Pzu Sa | 0 | -100,00 | 0 | |||||
| 2025-09-25 | NP | DCOR - Dimensional US Core Equity 1 ETF | 6.304 | 16,72 | 1.640 | 25,98 | ||||
| 2026-01-06 | 13F | Nelson, Van Denburg & Campbell Wealth Management Group, LLC | 3.686 | -17,34 | 925 | -27,81 | ||||
| 2026-02-17 | 13F | WFA of San Diego, LLC | 0 | -100,00 | 0 | |||||
| 2026-02-17 | 13F | Integrated Advisors Network LLC | 1.649 | 414 | ||||||
| 2026-02-13 | 13F | Smartleaf Asset Management LLC | 673 | 4,99 | 171 | -6,08 | ||||
| 2026-02-11 | 13F | SOUTH STATE Corp | 176 | 17,33 | 44 | 2,33 | ||||
| 2025-09-26 | NP | AIM INVESTMENT FUNDS (INVESCO INVESTMENT FUNDS) - Invesco Oppenheimer Discovery Mid Cap Growth Fund Class R6 | 237.101 | 0,00 | 61.665 | 7,91 | ||||
| 2026-02-11 | 13F | Pettyjohn, Wood & White, Inc | 1.124 | 2,84 | 282 | -10,22 | ||||
| 2025-11-06 | 13F | CBIZ Investment Advisory Services, LLC | 0 | -100,00 | 0 | |||||
| 2026-02-17 | 13F | Mercer Global Advisors Inc /adv | 17.942 | -2,32 | 4.501 | -14,62 | ||||
| 2026-02-12 | 13F | Ensign Peak Advisors, Inc | 9.891 | -53,97 | 2.481 | -59,78 | ||||
| 2026-02-18 | 13F | GWM Advisors LLC | 0 | -100,00 | 0 | |||||
| 2026-02-13 | 13F | Marshall Wace, Llp | 179.555 | 45.047 | ||||||
| 2025-09-29 | NP | GLBL - Pacer MSCI World Industry Advantage ETF | 2 | 0,00 | 1 | |||||
| 2026-02-17 | 13F | Hotchkis & Wiley Capital Management Llc | 368.938 | -2,10 | 92.559 | -14,44 | ||||
| 2026-02-13 | 13F | JustInvest LLC | 12.933 | -8,67 | 3.245 | -20,20 | ||||
| 2026-02-13 | 13F | Level Four Advisory Services, Llc | 1.034 | -4,52 | 259 | -16,45 | ||||
| 2026-02-23 | 13F | Virtu Financial LLC | 6.686 | 2 | ||||||
| 2026-02-06 | 13F | Creative Financial Designs Inc /adv | 16 | -5,88 | 4 | 0,00 | ||||
| 2026-02-12 | 13F | BRYN MAWR TRUST Co | 17.516 | -1,11 | 4.394 | -13,57 | ||||
| 2026-01-26 | 13F | KBC Group NV | 113.641 | 6,72 | 29 | -6,67 | ||||
| 2026-02-17 | 13F | Maryland State Retirement & Pension System | 4.094 | 0,00 | 1.027 | -12,60 | ||||
| 2026-02-18 | 13F | State of Tennessee, Treasury Department | 16.044 | -11,32 | 4.356 | -16,12 | ||||
| 2026-01-08 | 13F | NorthCrest Asset Manangement, LLC | 41.401 | 1,91 | 10.482 | -7,73 | ||||
| 2026-02-06 | 13F | Cullen/frost Bankers, Inc. | 176 | 8,64 | 44 | -4,35 | ||||
| 2026-02-17 | 13F | Lazard Asset Management Llc | 491.874 | 1,73 | 123.401 | -11,09 | ||||
| 2026-02-06 | 13F | Pnc Financial Services Group, Inc. | 37.979 | -4,47 | 9.528 | -16,51 | ||||
| 2026-02-23 | 13F | Wealth Preservation Advisors, LLC | 6 | 2 | ||||||
| 2025-09-26 | NP | WLDR - Affinity World Leaders Equity ETF | 906 | 23,94 | 236 | 33,52 | ||||
| 2026-02-06 | 13F | Motco | 110 | 0,00 | 28 | -12,90 | ||||
| 2026-02-13 | 13F | Wilkerson Advisory Group LLC | 5 | 1 | ||||||
| 2026-02-13 | 13F | Rhumbline Advisers | 152.635 | -1,00 | 38.293 | -13,48 | ||||
| 2026-02-13 | 13F | Sei Investments Co | 213.202 | 29,56 | 53.487 | 13,23 | ||||
| 2026-01-21 | 13F | Cidel Asset Management Inc | 941 | 0,00 | 236 | -12,59 | ||||
| 2026-02-05 | 13F | Beese Fulmer Investment Management, Inc. | 1.196 | 300 | ||||||
| 2026-01-27 | 13F | Proffitt & Goodson Inc | 0 | -100,00 | 0 | |||||
| 2026-02-10 | 13F | Evolution Wealth Management Inc. | 1 | 0,00 | 0 | |||||
| 2026-01-21 | 13F/A | Winthrop Advisory Group LLC | 0 | -100,00 | 0 | |||||
| 2026-02-02 | 13F | Core Alternative Capital | 0 | -100,00 | 0 | |||||
| 2026-02-05 | 13F | Northwestern Mutual Investment Management Company, Llc | 2.649 | 0,00 | 665 | -12,63 | ||||
| 2025-09-25 | NP | DFUV - Dimensional US Marketwide Value ETF | 54.485 | -6,93 | 14.170 | 0,43 | ||||
| 2025-09-26 | NP | IMCB - iShares Morningstar Mid-Cap ETF | 8.223 | 3,63 | 2.139 | 11,82 | ||||
| 2025-11-06 | 13F | Eubel Brady & Suttman Asset Management Inc | 0 | -100,00 | 0 | -100,00 | ||||
| 2026-01-09 | 13F | Assenagon Asset Management S.A. | 3.587 | -90,09 | 900 | -91,35 | ||||
| 2026-02-06 | 13F | Handelsbanken Fonder AB | 32.199 | 17,43 | 8 | 14,29 | ||||
| 2025-10-27 | 13F | Decker Retirement Planning Inc. | 0 | -100,00 | 0 | |||||
| 2026-02-11 | 13F | Meeder Advisory Services, Inc. | 977 | 245 | ||||||
| 2026-02-11 | 13F | Havemeyer Place LP | 8.678 | 2.177 | ||||||
| 2026-02-17 | 13F | Woodline Partners LP | 405.036 | 41,06 | 101.615 | 23,28 | ||||
| 2026-01-21 | 13F | Raleigh Capital Management Inc. | 145 | -98,73 | 36 | -98,90 | ||||
| 2026-02-10 | 13F | Norges Bank | 988.543 | 248.006 | ||||||
| 2026-02-10 | 13F | Kentucky Retirement Systems | 5.246 | 0,00 | 1.316 | -12,56 | ||||
| 2026-02-03 | 13F | Crossmark Global Holdings, Inc. | 3.992 | 32,76 | 1.002 | 15,99 | ||||
| 2026-02-11 | 13F | Deutsche Bank Ag\ | 348.023 | -1,34 | 87.312 | -13,77 | ||||
| 2026-01-20 | 13F | Hanson & Doremus Investment Management | 672 | 0,00 | 0 | |||||
| 2026-02-06 | 13F | Jag Capital Management, Llc | 12.496 | -0,45 | 3.135 | -13,02 | ||||
| 2026-02-04 | 13F | Kepler Cheuvreux (Suisse) SA | 13.507 | 3.389 | ||||||
| 2025-09-25 | NP | WRAAX - Wilmington Global Alpha Equities Fund Class A Shares | 1.076 | 280 | ||||||
| 2026-02-09 | 13F | White Pine Capital Llc | 1.543 | 0,19 | 387 | -12,44 | ||||
| 2026-01-28 | 13F | Teacher Retirement System Of Texas | 17.374 | -21,50 | 4.359 | -31,40 | ||||
| 2026-02-13 | 13F | Walleye Capital LLC | Call | 900 | -43,75 | 226 | -50,98 | |||
| 2025-09-25 | NP | PTMAX - PGIM QMA LARGE-CAP CORE EQUITY FUND Class A | 0 | -100,00 | 0 | -100,00 | ||||
| 2026-01-12 | 13F | Daymark Wealth Partners, Llc | 8.216 | 0,15 | 2.061 | -12,48 | ||||
| 2026-01-13 | 13F | Triangle Securities Wealth Management | 3.943 | -2,43 | 989 | -14,74 | ||||
| 2026-01-23 | 13F | Sumitomo Mitsui Trust Holdings, Inc. | 182.560 | -13,57 | 45.801 | -24,47 | ||||
| 2026-02-17 | 13F | Advisor Group Holdings, Inc. | 35.122 | -10,69 | 8.814 | -20,66 | ||||
| 2026-02-06 | 13F | Diamond Hill Capital Management Inc | 1.260.116 | -23,27 | 316.138 | -32,94 | ||||
| 2026-02-13 | 13F | River Wealth Advisors LLC | 0 | -100,00 | 0 | |||||
| 2026-02-13 | 13F | Dai-Ichi Life Insurance Company, Ltd | 3.745 | 0,00 | 940 | -12,65 | ||||
| 2026-02-03 | 13F | Luken Investment Analytics, LLC | 1 | 0 | ||||||
| 2026-02-10 | 13F | Envestnet Asset Management Inc | 244.113 | -6,77 | 61.243 | -18,52 | ||||
| 2026-02-17 | 13F | Toronto Dominion Bank | 37.794 | 23,27 | 9.482 | 7,73 | ||||
| 2025-09-26 | NP | TOV - JLens 500 Jewish Advocacy U.S. ETF | 250 | 23,15 | 65 | 35,42 | ||||
| 2025-11-17 | 13F | Kestra Investment Management, LLC | 0 | -100,00 | 0 | -100,00 | ||||
| 2026-01-27 | 13F | Davidson Trust Co | 970 | 243 | ||||||
| 2025-09-29 | NP | XTR - Global X S&P 500 Tail Risk ETF This fund is a listed as child fund of Mirae Asset Global Investments Co., Ltd. and if that institution has disclosed ownership in this security, then these positions will not be double counted when calculating total shares and total value | 3 | 0,00 | 1 | |||||
| 2026-02-12 | 13F | State Board Of Administration Of Florida Retirement System | 71.592 | 0,00 | 17.961 | -12,60 | ||||
| 2026-01-16 | 13F | First Pacific Financial | 0 | -100,00 | 0 | |||||
| 2026-02-09 | 13F | Coldstream Capital Management Inc | 2.400 | -1,64 | 602 | -14,00 | ||||
| 2026-02-11 | 13F | Metis Global Partners, LLC | 4.177 | -3,22 | 1.048 | -15,43 | ||||
| 2026-02-11 | 13F | Commonwealth Retirement Investments LLC | 17 | 4 | ||||||
| 2025-09-26 | NP | SUNAMERICA SERIES TRUST - SA JPMorgan Diversified Balanced Portfolio Class 1 | 1.405 | -1,33 | 365 | 6,41 | ||||
| 2026-02-10 | 13F | Marble Wealth, LLC | 2.401 | 602 | ||||||
| 2026-01-20 | 13F | Princeton Global Asset Management LLC | 93 | 0,00 | 23 | -11,54 | ||||
| 2026-02-12 | 13F | Oak Associates Ltd /oh/ | 62.982 | -2,58 | 15.801 | 87.677,78 | ||||
| 2025-09-25 | NP | DXUV - Dimensional US Vector Equity ETF | 689 | 94,63 | 179 | 110,59 | ||||
| 2025-09-26 | NP | FDMLX - Fidelity Series Intrinsic Opportunities Fund This fund is a listed as child fund of Fmr Llc and if that institution has disclosed ownership in this security, then these positions will not be double counted when calculating total shares and total value | 104.500 | -1,97 | 27.178 | 5,79 | ||||
| 2026-02-13 | 13F | Ubs Asset Management Americas Inc | 872.505 | -1,16 | 218.894 | -13,61 | ||||
| 2026-02-04 | 13F | HighPoint Advisor Group LLC | 1.275 | 0,16 | 320 | -12,60 | ||||
| 2026-02-03 | 13F | American Assets Investment Management, LLC | 18.000 | 0,00 | 4.516 | -12,62 | ||||
| 2026-02-17 | 13F | DV Trading LLC | 200 | 50 | ||||||
| 2026-02-17 | 13F | Russell Investments Group, Ltd. | 96.639 | 12,94 | 24.266 | -1,05 | ||||
| 2026-01-23 | 13F | Robeco Institutional Asset Management B.V. | 4.723 | -26,60 | 1.185 | -35,90 | ||||
| 2026-02-03 | 13F | Sequoia Financial Advisors, LLC | 127.618 | -11,43 | 32.017 | -22,59 | ||||
| 2026-02-06 | 13F | Envestnet Portfolio Solutions, Inc. | 5.877 | -6,15 | 1.475 | -17,97 | ||||
| 2026-02-09 | 13F | Barry Investment Advisors, LLC | 1.899 | -5,05 | 476 | -16,64 | ||||
| 2026-01-26 | 13F | Cwm, Llc | 7.453 | -9,44 | 2 | -50,00 | ||||
| 2026-01-21 | 13F | Clayton Financial Group LLC | 14 | 4 | ||||||
| 2026-02-11 | 13F | Fjarde Ap-fonden /fourth Swedish National Pension Fund | 15.547 | 3.900 | ||||||
| 2026-01-26 | 13F | Chicago Capital, LLC | 3.000 | 0,00 | 753 | -12,66 | ||||
| 2026-02-05 | 13F | Thrivent Financial For Lutherans | 577.027 | 2,49 | 145 | -10,56 | ||||
| 2026-01-22 | 13F | City Holding Co | 60 | 15 | ||||||
| 2026-02-05 | 13F | iA Global Asset Management Inc. | 7.609 | 2 | ||||||
| 2026-01-29 | 13F | State Of Michigan Retirement System | 23.287 | -3,32 | 5.842 | -15,50 | ||||
| 2025-09-26 | NP | JHAAX - Multi-Asset Absolute Return Fund Class A | 11.172 | -7,49 | 2.906 | -0,17 | ||||
| 2025-10-28 | 13F | Wolff Wiese Magana Llc | 0 | -100,00 | 0 | |||||
| 2026-02-11 | 13F | Illinois Municipal Retirement Fund | 51.200 | -6,37 | 12.845 | -18,17 | ||||
| 2026-02-12 | 13F | Hm Payson & Co | 2.214 | 0,00 | 555 | -12,60 | ||||
| 2026-02-05 | 13F | High Note Wealth, LLC | 14 | 0,00 | 4 | -25,00 | ||||
| 2026-01-30 | 13F | Keybank National Association/oh | 1.623 | 2,20 | 407 | -10,55 | ||||
| 2026-01-09 | 13F | SG Americas Securities, LLC | 68.082 | 225,49 | 17 | 183,33 | ||||
| 2025-09-26 | NP | PBAIX - Blackrock Tactical Opportunities Fund Institutional This fund is a listed as child fund of BlackRock, Inc. and if that institution has disclosed ownership in this security, then these positions will not be double counted when calculating total shares and total value | 10.044 | 0,00 | 2.612 | 7,93 | ||||
| 2026-02-09 | 13F | William Blair Investment Management, Llc | 1.277 | -7,73 | 320 | -19,40 | ||||
| 2026-02-10 | 13F | Principia Wealth Advisory, LLC | 7 | 16,67 | 2 | 0,00 | ||||
| 2026-02-11 | 13F | Simplex Trading, Llc | 3.642 | 24,39 | 914 | |||||
| 2026-02-11 | 13F | Prestige Wealth Management Group LLC | 43 | -10,42 | 11 | -23,08 | ||||
| 2026-02-10 | 13F | Clear Harbor Asset Management, LLC | 5.625 | 1,11 | 1.411 | -11,59 | ||||
| 2026-02-17 | 13F | Tcw Group Inc | 1.317 | 330 | ||||||
| 2026-02-06 | 13F | Leonteq Securities AG | 2 | 0,00 | 1 | |||||
| 2026-02-13 | 13F | William B. Walkup & Associates, Inc. | 9.646 | -0,06 | 2.420 | -12,67 | ||||
| 2026-01-27 | 13F | TD Waterhouse Canada Inc. | 535 | -2,73 | 134 | -12,42 | ||||
| 2026-01-28 | 13F | White Pine Investment CO | 18.380 | -1,02 | 5 | -20,00 | ||||
| 2025-11-14 | 13F | Jain Global LLC | 0 | -100,00 | 0 | |||||
| 2025-09-26 | NP | PCLVX - PACE Large Co Value Equity Investments Class P | 3.106 | 0,00 | 808 | 7,89 | ||||
| 2026-01-13 | 13F | CoreCap Advisors, LLC | 236 | -0,84 | 59 | -13,24 | ||||
| 2026-02-02 | 13F | Benjamin Edwards Inc | 2.065 | 82,10 | 518 | 59,08 | ||||
| 2025-09-29 | NP | HCMT - Direxion HCM Tactical Enhanced US ETF | 623 | 23,86 | 162 | 33,88 | ||||
| 2026-02-12 | 13F | Mount Yale Investment Advisors, LLC | 1.090 | -15,18 | 273 | -25,82 | ||||
| 2026-02-17 | 13F | Css Llc/il | 1.950 | 489 | ||||||
| 2025-09-29 | NP | CFMCX - Column Mid Cap Fund | 27.959 | -3,29 | 7.772 | 7,99 | ||||
| 2026-02-09 | 13F | Key FInancial Inc | 1.184 | -3,35 | 297 | -12,90 | ||||
| 2026-02-05 | 13F | AlphaCore Capital LLC | 5.281 | 56,89 | 1.325 | 37,06 | ||||
| 2026-02-12 | 13F | Douglass Winthrop Advisors, LLC | 1.773 | 25,12 | 445 | 9,36 | ||||
| 2026-01-30 | 13F | State of New Jersey Common Pension Fund D | 27.766 | -2,37 | 6.966 | -14,68 | ||||
| 2026-02-12 | 13F | APG Asset Management N.V. | 48.456 | 4,21 | 10.351 | -8,89 | ||||
| 2026-01-23 | 13F | Galvin, Gaustad & Stein, LLC | 899 | 0,00 | 226 | -12,79 | ||||
| 2026-02-17 | 13F | Jump Financial, LLC | 2.295 | -18,09 | 576 | -28,48 | ||||
| 2025-09-25 | NP | IMCV - iShares Morningstar Mid-Cap Value ETF | 10.528 | -1,44 | 2.738 | 6,37 | ||||
| 2025-09-26 | NP | USSCX - Science & Technology Fund Shares | 414 | -0,96 | 108 | 7,00 | ||||
| 2026-02-11 | 13F | MCF Advisors LLC | 0 | -100,00 | 0 | |||||
| 2026-02-11 | 13F | Zions Bancorporation, National Association /ut/ | 289 | 21,94 | 73 | 5,88 | ||||
| 2026-02-03 | 13F | Strengthening Families & Communities, LLC | 0 | -100,00 | 0 | |||||
| 2026-02-13 | 13F | Kcm Investment Advisors Llc | 31.242 | -1,24 | 7.838 | -13,69 | ||||
| 2026-02-12 | 13F | QSV Equity Investors LLC | 1.580 | -4,13 | 396 | -16,28 | ||||
| 2026-02-11 | 13F | Tiaa Trust, National Association | 4.081 | 5,78 | 1.024 | -7,59 | ||||
| 2025-11-14 | 13F/A | AMF Pensionsforsakring AB | 34.225 | 0,00 | 9.825 | 9,30 | ||||
| 2026-02-13 | 13F | MAI Capital Management | 35.568 | 0,71 | 8.923 | -11,98 | ||||
| 2026-02-13 | 13F | Chevy Chase Trust Holdings, Inc. | 45.608 | -0,87 | 11.442 | -13,36 | ||||
| 2026-02-19 | 13F | Invesco Ltd. | 1.391.978 | 7,07 | 349.220 | -6,43 | ||||
| 2025-11-13 | 13F | Riggs Asset Managment Co. Inc. | 0 | -100,00 | 0 | |||||
| 2026-02-03 | 13F | Generali Asset Management SPA SGR | 19.906 | 7,05 | 4.994 | -6,43 | ||||
| 2026-02-10 | 13F | Savant Capital, LLC | 3.782 | 4,24 | 949 | -8,93 | ||||
| 2025-09-29 | NP | KCXIX - Knights of Columbus U.S. All Cap Index Fund I Shares | 374 | 2,19 | 97 | 10,23 | ||||
| 2026-02-13 | 13F | Colony Group, LLC | 22.273 | 37,63 | 5.588 | 20,33 | ||||
| 2026-02-18 | 13F | EP Wealth Advisors, Inc. | 2.048 | 21,18 | 514 | 15,80 | ||||
| 2026-02-12 | 13F | McMillan Office, Inc. | 6 | 2 | ||||||
| 2026-01-12 | 13F | Rialto Wealth Management, LLC | 6 | -14,29 | 2 | -50,00 | ||||
| 2026-02-13 | 13F | Wells Fargo & Company/mn | 303.434 | -3,03 | 76.125 | -15,25 | ||||
| 2025-09-25 | NP | JPME - JPMorgan Diversified Return U.S. Mid Cap Equity ETF | 5.350 | -5,44 | 1.391 | 2,05 | ||||
| 2026-02-13 | 13F | Sofos Investments, Inc. | 0 | -100,00 | 0 | |||||
| 2026-02-13 | 13F | Ausdal Financial Partners, Inc. | 2.413 | 12,65 | 605 | -1,47 | ||||
| 2026-02-17 | 13F | Two Sigma Securities, Llc | 0 | -100,00 | 0 | |||||
| 2025-09-29 | NP | SZNE - Pacer CFRA-Stovall Equal Weight Seasonal Rotation ETF | 501 | -66,80 | 130 | -60,00 | ||||
| 2026-01-29 | 13F | UMA Financial Services, Inc. | 6 | -86,67 | 2 | -91,67 | ||||
| 2026-02-13 | 13F | Financial Sense Advisors, Inc. | 1.211 | 0,25 | 304 | -12,43 | ||||
| 2026-01-29 | 13F | Inscription Capital, LLC | 1.978 | 496 | ||||||
| 2026-01-13 | 13F | Capital Investment Advisors, LLC | 808 | -34,31 | 203 | -42,78 | ||||
| 2026-02-10 | 13F | 3Chopt Investment Partners, LLC | 4.834 | -3,42 | 1.213 | -15,60 | ||||
| 2026-02-17 | 13F | Royal Bank Of Canada | 686.893 | -14,99 | 172.328 | -25,70 | ||||
| 2026-02-13 | 13F | Neuberger Berman Group LLC | 12.012 | -4,73 | 3.014 | -16,74 | ||||
| 2025-09-25 | NP | HGHAX - THE HARTFORD HEALTHCARE FUND Class A | 31.652 | -7,30 | 8.232 | 0,04 | ||||
| 2026-02-17 | 13F | Quantitative Investment Management, LLC | 4.921 | 1 | ||||||
| 2026-01-21 | 13F | MBL Wealth, LLC | 29.372 | 0,02 | 7.369 | -12,60 | ||||
| 2026-01-23 | 13F | Aspect Partners, LLC | 4 | 100,00 | 1 | |||||
| 2026-02-10 | 13F | AXS Investments LLC | 4.024 | -3,85 | 1.010 | -15,99 | ||||
| 2026-01-27 | 13F | Lodestar Private Asset Management Llc | 823 | 10,03 | 206 | -3,74 | ||||
| 2025-09-29 | NP | SPXL - Direxion Daily S&P 500(R) Bull 3X Shares | 5.805 | 16,57 | 1.510 | 25,75 | ||||
| 2025-09-29 | NP | SPUU - Direxion Daily S&P 500(R) Bull 2X Shares | 262 | 25,96 | 68 | 36,00 | ||||
| 2026-02-13 | 13F | Schroder Investment Management Group | 5.716 | -69,57 | 1.434 | -73,41 | ||||
| 2026-02-13 | 13F | Alyeska Investment Group, L.P. | 185.000 | 5.571,37 | 46.413 | 4.858,55 | ||||
| 2026-02-13 | 13F | Cetera Trust Company, N.A | 20 | 0,00 | 5 | 0,00 | ||||
| 2026-02-09 | 13F | Prospera Financial Services Inc | 1.451 | -3,27 | 364 | -15,55 | ||||
| 2026-02-17 | 13F | Lighthouse Investment Partners, LLC | 0 | -100,00 | 0 | |||||
| 2026-02-13 | 13F | Bridgewater Associates, LP | 17.366 | 67,09 | 4.357 | 46,03 | ||||
| 2025-09-26 | NP | EPMB - Harbor Mid Cap Core ETF | 259 | 67 | ||||||
| 2025-11-06 | 13F | Wedbush Securities Inc | 0 | -100,00 | 0 | |||||
| 2026-01-29 | 13F | D.a. Davidson & Co. | 15.751 | 8,92 | 3.952 | -4,82 | ||||
| 2025-09-25 | NP | AAUTX - Thrivent Large Cap Value Fund Class A | 145.152 | 0,95 | 37.751 | 8,93 | ||||
| 2026-02-10 | 13F/A | Northwestern Mutual Wealth Management Co | 3.569 | -9,37 | 895 | -20,80 | ||||
| 2025-09-29 | NP | CVSIX - Calamos Market Neutral Income Fund Class A | 45.282 | 0,00 | 11.777 | 7,91 | ||||
| 2026-02-17 | 13F | Engineers Gate Manager LP | 0 | -100,00 | 0 | |||||
| 2026-02-12 | 13F | Connecticut Wealth Management, LLC | 0 | -100,00 | 0 | |||||
| 2026-02-13 | 13F | Toroso Investments, LLC | 11.314 | 39,59 | 2.838 | 22,01 | ||||
| 2025-11-07 | 13F | Sierra Ocean, Llc | 0 | -100,00 | 0 | -100,00 | ||||
| 2026-02-03 | 13F | Mitsubishi UFJ Kokusai Asset Management Co., Ltd. | 177.338 | 5,19 | 44.629 | -7,78 | ||||
| 2026-02-05 | 13F | John G Ullman & Associates Inc | 2.210 | 0,00 | 554 | -12,62 | ||||
| 2026-01-23 | 13F | Iridian Asset Management Llc/ct | 3.644 | -8,74 | 914 | -20,24 | ||||
| 2025-09-26 | NP | GGHCX - INVESCO Health Care Fund Class A | 68.315 | 2,59 | 17.767 | 10,71 | ||||
| 2025-09-29 | NP | WOGSX - White Oak Select Growth Fund | 47.770 | 0,00 | 12.424 | 7,91 | ||||
| 2025-11-12 | 13F | Sciencast Management LP | 0 | -100,00 | 0 | |||||
| 2026-02-10 | 13F | Rothschild Investment Llc | 37 | -21,28 | 9 | -30,77 | ||||
| 2026-01-28 | 13F | Legacy Capital Group California, Inc. | 2.551 | -0,58 | 640 | -13,18 | ||||
| 2026-02-12 | 13F | Te Ahumairangi Investment Management Ltd | 0 | -100,00 | 0 | |||||
| 2026-01-05 | 13F | Park Avenue Securities Llc | 4.843 | -9,12 | 1 | 0,00 | ||||
| 2026-02-17 | 13F | Snowden Capital Advisors LLC | 1.616 | -7,76 | 405 | -19,32 | ||||
| 2025-09-26 | NP | HMCNX - Harbor Mid Cap Fund Investor Class | 11.304 | -2,16 | 2.940 | 5,57 | ||||
| 2026-01-23 | 13F | Steigerwald, Gordon & Koch Inc. | 289 | 0,00 | 73 | -12,20 | ||||
| 2025-10-24 | 13F | Hemington Wealth Management | 173 | 3,59 | 0 | |||||
| 2026-02-17 | 13F | Nissay Asset Management Corp /japan/ /adv | 10.758 | 0,51 | 2.699 | -12,17 | ||||
| 2026-02-05 | 13F | Pinnacle Associates Ltd | 1.126 | 3,87 | 282 | -9,32 | ||||
| 2026-01-15 | 13F | Mn Services Vermogensbeheer B.V. | 32.180 | 4,15 | 8 | 0,00 | ||||
| 2026-01-27 | 13F | Osborne Partners Capital Management, Llc | 0 | -100,00 | 0 | |||||
| 2026-01-12 | 13F | CVA Family Office, LLC | 48 | -23,81 | 12 | -33,33 | ||||
| 2026-02-10 | 13F | Shepherd Street Advisors LLC | 1.836 | 461 | ||||||
| 2026-02-13 | 13F | Corient IA LLC | 1.300 | 0,00 | 326 | -12,60 | ||||
| 2026-01-16 | 13F | Linden Thomas Advisory Services, LLC | 939 | -1,47 | 236 | -13,92 | ||||
| 2026-02-10 | 13F | Mutual Of America Capital Management Llc | 8.925 | -1,14 | 2.239 | -13,59 | ||||
| 2025-09-25 | NP | ILCV - iShares Morningstar Large-Cap Value ETF | 3.445 | -3,85 | 896 | 3,71 | ||||
| 2026-01-21 | 13F | Newbridge Financial Services Group, Inc. | 91 | 127,50 | 23 | 100,00 | ||||
| 2026-02-06 | 13F | Resona Asset Management Co.,Ltd. | 26.241 | -2,59 | 6.593 | -14,53 | ||||
| 2026-02-13 | 13F | Ostrum Asset Management | 386 | -25,05 | 97 | -34,69 | ||||
| 2026-02-17 | 13F | Persistent Asset Partners Ltd | 0 | -100,00 | 0 | |||||
| 2026-01-20 | 13F | eCIO, Inc. | 231 | 58 | ||||||
| 2026-01-20 | 13F | Trust Co Of Toledo Na /oh/ | 643 | 0,00 | 161 | -12,50 | ||||
| 2026-02-12 | 13F | Benson Wealth Management INC | 6 | 2 | ||||||
| 2025-09-25 | NP | DFA INVESTMENT DIMENSIONS GROUP INC - U.S. Social Core Equity 2 Portfolio Shares | 5.445 | 6,72 | 1.416 | 15,22 | ||||
| 2026-02-09 | 13F | Harbour Investments, Inc. | 1.191 | -4,26 | 299 | -16,29 | ||||
| 2026-02-12 | 13F | Qtron Investments LLC | 2.173 | 545 | ||||||
| 2026-02-13 | 13F | Kilter Group LLC | 6 | 100,00 | 2 | |||||
| 2026-02-25 | 13F | Hahn Capital Management Llc | 31.279 | -5,76 | 7.847 | -17,64 | ||||
| 2026-02-17 | 13F | California State Teachers Retirement System | 123.465 | -3,35 | 30.975 | -15,54 | ||||
| 2026-02-02 | 13F | Danske Bank A/s | 41.602 | 17,12 | 10.437 | 2,36 | ||||
| 2026-02-03 | 13F | Stevens Capital Management Lp | 0 | -100,00 | 0 | |||||
| 2025-09-25 | NP | TMCVX - Thrivent Mid Cap Value Fund Class S | 1.889 | -10,77 | 491 | -3,73 | ||||
| 2026-02-11 | 13F | Cedar Mountain Advisors, LLC | 15 | 0,00 | 4 | -25,00 | ||||
| 2026-02-13 | 13F | Cornerstone Advisors, LLC | 28.701 | 7.201 | ||||||
| 2026-02-12 | 13F | Davis R M Inc | 896 | 0,00 | 225 | -12,84 | ||||
| 2026-02-11 | 13F | Cerity Partners LLC | 69.248 | -11,66 | 17.385 | -22,73 | ||||
| 2026-02-06 | 13F | Banque Cantonale Vaudoise | 0 | -100,00 | 0 | |||||
| 2026-02-17 | 13F | Man Group plc | 53.883 | 477,83 | 13.518 | 405,16 | ||||
| 2026-02-06 | 13F | ProShare Advisors LLC | 15.966 | 8,32 | 4.006 | -5,32 | ||||
| 2025-09-26 | NP | FSMDX - Fidelity Mid Cap Index Fund This fund is a listed as child fund of Fmr Llc and if that institution has disclosed ownership in this security, then these positions will not be double counted when calculating total shares and total value | 296.308 | 4,75 | 77.064 | 13,03 | ||||
| 2026-01-16 | 13F | Marquette Asset Management, LLC | 0 | -100,00 | 0 | |||||
| 2026-02-12 | 13F | UniSuper Management Pty Ltd | 10.428 | -12,29 | 2.616 | -23,33 | ||||
| 2026-02-13 | 13F | Arrowstreet Capital, Limited Partnership | 0 | -100,00 | 0 | |||||
| 2025-09-26 | NP | RTDAX - Multifactor U.S. Equity Fund Class A | 1.428 | 104,58 | 371 | 120,83 | ||||
| 2026-02-17 | 13F | Polymer Capital Management (US) LLC | 4.383 | 1.100 | ||||||
| 2026-02-13 | 13F | Virtus ETF Advisers LLC | 95 | 0,00 | 24 | -14,81 | ||||
| 2026-02-13 | 13F | Walleye Trading LLC | Put | 100 | 25 | |||||
| 2026-01-21 | 13F | Inlet Private Wealth, LLC | 13.944 | -6,69 | 3.498 | -18,44 | ||||
| 2026-02-13 | 13F | Walleye Trading LLC | 934 | 234 | ||||||
| 2026-01-27 | 13F | First Horizon Corp | 2.728 | 1,98 | 684 | -10,82 | ||||
| 2026-01-30 | 13F | Ares Financial Consulting, LLC | 6 | 2 | ||||||
| 2026-01-20 | 13F | Ntv Asset Management Llc | 1.000 | 0,00 | 251 | -12,89 | ||||
| 2026-02-17 | 13F | LMR Partners LLP | 0 | -100,00 | 0 | |||||
| 2026-01-15 | 13F | Fifth Third Wealth Advisors LLC | 1.047 | -1,04 | 263 | -13,53 | ||||
| 2026-01-26 | 13F | Grandview Asset Management LLC | 1.854 | 0,05 | 465 | -12,43 | ||||
| 2026-01-16 | 13F | Montgomery Investment Management Inc | 4.810 | 0,00 | 1.207 | -12,61 | ||||
| 2026-02-04 | 13F | Paradigm Asset Management Co Llc | 501 | 0,00 | 126 | -12,59 | ||||
| 2026-02-02 | 13F | CENTRAL TRUST Co | 841 | 0,48 | 211 | -12,50 | ||||
| 2025-09-29 | NP | QDPL - Pacer Metaurus US Large Cap Dividend Multiplier 400 ETF | 1.492 | 13,46 | 388 | 22,78 | ||||
| 2026-01-07 | 13F | Parisi Gray Wealth Management | 2.402 | 0,00 | 603 | -12,63 | ||||
| 2026-02-09 | 13F | Frazier Financial Advisors, LLC | 100 | 0,00 | 25 | -10,71 | ||||
| 2026-02-12 | 13F | Affinity Investment Advisors, Llc | 894 | -8,87 | 224 | -20,28 | ||||
| 2026-02-17 | 13F | Guggenheim Capital Llc | 5.581 | -5,15 | 1.400 | -17,11 | ||||
| 2026-02-10 | 13F | BlackDiamond Wealth Management Inc. | 1.135 | -2,32 | 311 | -6,91 | ||||
| 2026-01-14 | 13F | Pallas Capital Advisors LLC | 1.549 | -3,31 | 389 | -15,47 | ||||
| 2026-01-15 | 13F | Jamison Private Wealth Management, Inc. | 825 | 0,00 | 207 | -12,71 | ||||
| 2026-01-16 | 13F | Louisiana State Employees Retirement System | 4.200 | -4,55 | 1.054 | -16,63 | ||||
| 2026-02-18 | 13F | Mackenzie Financial Corp | 19.306 | 34,83 | 4.876 | 18,64 | ||||
| 2026-02-13 | 13F | Fairfield, Bush & Co. | 8.068 | -17,77 | 2.024 | -28,12 | ||||
| 2026-01-23 | 13F | State of Alaska, Department of Revenue | 11.798 | 24,54 | 3 | 0,00 | ||||
| 2025-09-26 | NP | AADEX - American Beacon Large Cap Value Fund Institutional Class | 19.880 | -9,14 | 5.170 | -1,95 | ||||
| 2026-01-21 | 13F | Azzad Asset Management Inc /adv | 2.176 | 0,18 | 546 | -12,52 | ||||
| 2026-01-27 | 13F | Birch Hill Investment Advisors LLC | 82.505 | -31,00 | 20.699 | -39,70 | ||||
| 2026-02-24 | 13F | River Road Asset Management, LLC | 408.256 | 13,41 | 102.423 | -0,88 | ||||
| 2026-02-17 | 13F | Fairview Capital Investment Management, Llc | 232.020 | -0,40 | 58.209 | -12,95 | ||||
| 2026-01-21 | 13F | Franklin Street Advisors Inc /nc | 0 | -100,00 | 0 | |||||
| 2026-02-11 | 13F | Fox Run Management, L.l.c. | 7.086 | 1.778 | ||||||
| 2026-02-06 | 13F | Signature Estate & Investment Advisors Llc | 24.040 | 2,92 | 6.031 | -10,05 | ||||
| 2026-02-09 | 13F | Huntington National Bank | 1 | 0,00 | 0 | |||||
| 2026-02-13 | 13F | Foresight Global Investors, Inc. | 1.273 | 0,00 | 319 | -12,60 | ||||
| 2026-01-23 | 13F | Cambiar Investors Llc | 195.315 | -1,29 | 49.001 | -13,73 | ||||
| 2026-01-26 | 13F | BLB&B Advisors, LLC | 0 | -100,00 | 0 | |||||
| 2026-01-07 | 13F | Retirement Wealth Solutions LLC | 17 | 0,00 | 4 | 0,00 | ||||
| 2026-01-22 | 13F | Northcape Wealth Management, Llc | 1.100 | 0,00 | 276 | -12,70 | ||||
| 2025-09-25 | NP | Thrivent Core Funds - Thrivent Core Mid Cap Value Fund | 19.007 | -48,71 | 4.943 | -44,65 | ||||
| 2025-10-22 | 13F | Stanley-Laman Group, Ltd. | 0 | -100,00 | 0 | |||||
| 2026-02-11 | 13F | Erste Asset Management GmbH | 0 | 0 | ||||||
| 2025-09-25 | NP | VT - Vanguard Total World Stock Index Fund ETF Shares | 58.064 | 4,29 | 15.101 | 12,55 | ||||
| 2026-02-11 | 13F | Dorsey & Whitney Trust CO LLC | 3.296 | -2,17 | 827 | -14,58 | ||||
| 2025-11-13 | 13F | Banco BTG Pactual S.A. | 0 | -100,00 | 0 | -100,00 | ||||
| 2025-09-25 | NP | DFAC - Dimensional U.S. Core Equity 2 ETF | 106.995 | 49,02 | 27.827 | 60,81 | ||||
| 2026-02-10 | 13F | Lido Advisors, LLC | 2.258 | 2,50 | 641 | 1,42 | ||||
| 2026-02-13 | 13F | Tradewinds, LLC. | 916 | -0,11 | 230 | -12,93 | ||||
| 2025-11-14 | 13F | Mbb Public Markets I Llc | 0 | -100,00 | 0 | |||||
| 2026-02-23 | 13F | Beaird Harris Wealth Management, LLC | 1 | -83,33 | 0 | -100,00 | ||||
| 2026-01-07 | 13F | Impact Capital Partners LLC | 801 | -1,84 | 201 | -14,53 | ||||
| 2026-01-20 | 13F | Signaturefd, Llc | 709 | -6,09 | 178 | -18,06 | ||||
| 2026-02-09 | 13F | Wealth Advisors of Tampa Bay, LLC | 2.601 | -0,95 | 653 | -13,41 | ||||
| 2026-02-12 | 13F | MetLife Investment Management, LLC | 19.883 | -3,61 | 4.988 | -15,76 | ||||
| 2025-09-25 | NP | JPUS - JPMorgan Diversified Return U.S. Equity ETF | 4.184 | -2,95 | 1.088 | 4,82 | ||||
| 2026-01-26 | 13F | Harbor Asset Planning, Inc. | 94 | 0,00 | 24 | -11,54 | ||||
| 2026-01-14 | 13F | Wealthcare Advisory Partners LLC | 2.289 | -4,98 | 574 | -16,93 | ||||
| 2026-02-05 | 13F | New York Life Investment Management Llc | 12.068 | -0,70 | 3.028 | -13,22 | ||||
| 2026-02-13 | 13F | Inspire Advisors, LLC | 3.927 | 2,45 | 985 | -10,45 | ||||
| 2026-01-13 | 13F | Norden Group Llc | 2.696 | -0,52 | 676 | -13,00 | ||||
| 2026-01-21 | 13F | Sivik Global Healthcare LLC | 0 | -100,00 | 0 | |||||
| 2026-02-13 | 13F | Royal London Asset Management Ltd | 36.618 | 0,46 | 9.187 | -12,20 | ||||
| 2026-01-22 | 13F | Harwood Advisory Group, LLC | 65 | 0,00 | 16 | -11,11 | ||||
| 2026-02-10 | 13F | Kentucky Retirement Systems Insurance Trust Fund | 2.199 | 0,00 | 552 | -12,68 | ||||
| 2026-02-11 | 13F | Los Angeles Capital Management Llc | 8.329 | -2,08 | 2.102 | -13,93 | ||||
| 2026-02-04 | 13F | Sentry Investment Management Llc | 176 | 0,00 | 0 | |||||
| 2026-02-12 | 13F | Penserra Capital Management LLC | 6 | 100,00 | 0 | |||||
| 2026-01-30 | 13F | Cardinal Capital Management | 38.401 | 1,02 | 9.634 | -11,70 | ||||
| 2026-02-09 | 13F | Lathrop Investment Management Corp | 69.458 | -0,08 | 17 | -10,53 | ||||
| 2026-01-30 | 13F | Kohmann Bosshard Financial Services, LLC | 180 | 45 | ||||||
| 2026-01-30 | 13F | Arlington Trust Co LLC | 35 | 9 | ||||||
| 2026-02-02 | 13F | Fifth Third Bancorp | 28.082 | -0,80 | 7.045 | -13,30 | ||||
| 2026-02-12 | 13F | Swiss National Bank | 228.020 | -5,51 | 57.206 | -17,42 | ||||
| 2026-01-22 | 13F | Venturi Wealth Management, LLC | 2.479 | 1,14 | 622 | -11,66 | ||||
| 2026-02-17 | 13F | Centennial Bank/AR/ | 24 | 0,00 | 6 | 0,00 | ||||
| 2026-01-20 | 13F | Cigna Investments Inc /new | 822 | 0,00 | 0 | |||||
| 2026-02-17 | 13F | Tudor Investment Corp Et Al | 2.309 | 579 | ||||||
| 2025-10-17 | 13F | Oak Harvest Investment Services | 0 | -100,00 | 0 | |||||
| 2026-01-09 | 13F | Bdf-gestion | 7.642 | -6,26 | 1.917 | -18,08 | ||||
| 2026-02-27 | 13F | Strategic Investment Solutions, Inc. /IL | 9 | 0,00 | 2 | 0,00 | ||||
| 2026-02-17 | 13F | Tudor Investment Corp Et Al | Call | 1.200 | -40,00 | 301 | -47,56 | |||
| 2026-02-17 | 13F | Cape Investment Advisory, Inc. | 152 | 12,59 | 38 | 0,00 | ||||
| 2026-01-15 | 13F | Nisa Investment Advisors, Llc | 34.520 | 2,28 | 8.660 | -10,61 | ||||
| 2025-11-18 | 13F | Integrated Investment Consultants, LLC | 0 | -100,00 | 0 | |||||
| 2026-01-23 | 13F | Pinnacle Wealth Management Group, Inc. | 0 | -100,00 | 0 | |||||
| 2025-09-25 | NP | TAAAX - Thrivent Aggressive Allocation Fund Class A | 19.098 | 26,91 | 4.967 | 36,98 | ||||
| 2026-01-26 | 13F | BCS Private Wealth Management, Inc. | 1.487 | -1,33 | 373 | -13,66 | ||||
| 2025-09-26 | NP | RETSX - Tax-Managed U.S. Large Cap Fund Class S | 10.723 | 0,00 | 2.789 | 7,89 | ||||
| 2026-02-17 | 13F | Aqr Capital Management Llc | 57.488 | -64,80 | 14.422 | -68,93 | ||||
| 2026-02-17 | 13F | Bank Of America Corp /de/ | 736.335 | 1,41 | 184.732 | -11,37 | ||||
| 2026-02-13 | 13F | Satovsky Asset Management Llc | 1.136 | 1,34 | 285 | -11,53 | ||||
| 2026-01-20 | 13F | Tritonpoint Wealth, Llc | 10.944 | -0,03 | 2.746 | -12,64 | ||||
| 2025-11-03 | 13F | Stonegate Investment Group, LLC | 0 | -100,00 | 0 | |||||
| 2026-01-28 | 13F | Boston Trust Walden Corp | 0 | -100,00 | 0 | |||||
| 2026-02-09 | 13F/A | Swedbank AB | 57.379 | 0,81 | 14.395 | -11,90 | ||||
| 2026-02-17 | 13F | Laird Norton Trust Company, Llc | 2.872 | 721 | ||||||
| 2026-01-28 | 13F | Absher Wealth Management, Llc | 0 | -100,00 | 0 | |||||
| 2026-02-06 | 13F | Covestor Ltd | 529 | -18,87 | 0 | |||||
| 2026-02-13 | 13F | Y-Intercept (Hong Kong) Ltd | 22.506 | 5.646 | ||||||
| 2025-09-26 | NP | BlackRock Funds II - BLACKROCK MULTI-ASSET INCOME PORTFOLIO INVESTOR C SHARES | 836 | -96,02 | 217 | -95,71 | ||||
| 2026-01-16 | 13F | Standard Life Aberdeen plc | 68.049 | -0,72 | 17.072 | -11,91 | ||||
| 2026-02-10 | 13F | Strategic Advisors LLC | 4.082 | 70,15 | 1.024 | 48,84 | ||||
| 2026-01-22 | 13F | Pinnacle Bancorp, Inc. | 1.091 | 0,00 | 274 | -12,78 | ||||
| 2026-02-13 | 13F | Healthcare Of Ontario Pension Plan Trust Fund | 3.277 | -0,40 | 822 | -12,92 | ||||
| 2026-02-02 | 13F | Millstone Evans Group, LLC | 14 | 0,00 | 4 | -25,00 | ||||
| 2026-02-12 | 13F | Cloud Capital Management, LLC | 0 | -100,00 | 0 | |||||
| 2025-09-25 | NP | DFSU - Dimensional US Sustainability Core 1 ETF | 2.940 | 46,27 | 765 | 57,85 | ||||
| 2026-02-13 | 13F | Victory Capital Management Inc | 5.356.825 | 103,11 | 1.343.922 | 77,56 | ||||
| 2026-01-15 | 13F | Allspring Global Investments Holdings, LLC | 2.204.276 | 10,42 | 554.728 | -0,42 | ||||
| 2026-01-21 | 13F | Aaron Wealth Advisors LLC | 1.278 | 4,93 | 321 | -8,31 | ||||
| 2026-01-29 | 13F | Advisors Capital Management, LLC | 1.435 | 0,00 | 360 | -12,62 | ||||
| 2026-01-07 | 13F | Massmutual Trust Co Fsb/adv | 424 | -1,17 | 106 | -13,82 | ||||
| 2026-01-14 | 13F | Jfs Wealth Advisors, Llc | 65 | 35,42 | 16 | 23,08 | ||||
| 2026-02-10 | 13F | Commonwealth Of Pennsylvania Public School Empls Retrmt Sys | 19.283 | -3,37 | 4.838 | -15,56 | ||||
| 2026-02-11 | 13F | Deseret Mutual Benefit Administrators | 432 | -6,29 | 108 | -18,18 | ||||
| 2026-02-17 | 13F | Auxier Asset Management | 950 | 0,00 | 238 | -12,50 | ||||
| 2026-02-05 | 13F | Dana Investment Advisors, Inc. | 8.237 | -0,28 | 2.066 | -12,86 | ||||
| 2025-09-29 | NP | CAMX - Cambiar Aggressive Value ETF | 8.100 | -22,46 | 2.107 | -16,33 | ||||
| 2025-09-25 | NP | VASVX - Vanguard Selected Value Fund Investor Shares | 279.220 | -1,62 | 72.620 | 6,16 | ||||
| 2025-09-29 | NP | AIM INVESTMENT FUNDS (INVESCO INVESTMENT FUNDS) - Invesco Oppenheimer Global Allocation Fund Class R | 1.880 | 0,00 | 489 | 7,73 | ||||
| 2026-01-22 | 13F | Financial Consulate, Inc | 5 | 0,00 | 1 | 0,00 | ||||
| 2025-11-17 | 13F | LGT Financial Advisors LLC | 0 | -100,00 | 0 | |||||
| 2025-09-26 | NP | FLKSX - Fidelity Low-Priced Stock K6 Fund This fund is a listed as child fund of Fmr Llc and if that institution has disclosed ownership in this security, then these positions will not be double counted when calculating total shares and total value | 115.182 | 7,88 | 29.957 | 16,41 | ||||
| 2025-09-25 | NP | DFUS - Dimensional U.S. Equity ETF | 22.885 | 4,92 | 5.952 | 13,22 | ||||
| 2025-09-26 | NP | RAZAX - Multi-Asset Growth Strategy Fund Class A | 668 | 0,00 | 174 | 8,13 | ||||
| 2026-02-13 | 13F | Transamerica Financial Advisors, Inc. | 206 | 52 | ||||||
| 2025-09-25 | NP | QUVU - Hartford Quality Value ETF | 8.323 | 2.165 | ||||||
| 2026-02-04 | 13F | Clark Wealth Partners | 0 | -100,00 | 0 | |||||
| 2026-02-17 | 13F | NorthRock Partners, LLC | 1.871 | -33,96 | 469 | -42,31 | ||||
| 2026-01-29 | 13F | UBS Group AG | 495.535 | 2,17 | 124.320 | -10,71 | ||||
| 2026-02-12 | 13F | Xponance, Inc. | 14.236 | 16,30 | 3.572 | 1,65 | ||||
| 2025-09-25 | NP | BBUS - JPMorgan BetaBuilders U.S. Equity ETF | 7.853 | 6,63 | 2.042 | 15,04 | ||||
| 2026-02-13 | 13F | Police & Firemen's Retirement System of New Jersey | 12.770 | -4,80 | 3.204 | -16,81 | ||||
| 2026-02-10 | 13F | Daiwa Securities Group Inc. | 13.440 | 2,75 | 3 | 0,00 | ||||
| 2026-01-29 | 13F | S.A. Mason LLC | 2.006 | 0,00 | 503 | -12,52 | ||||
| 2026-03-04 | 13F | SHP Wealth Management | 160 | 40 | ||||||
| 2026-01-27 | 13F | GHP Investment Advisors, Inc. | 34.741 | -2,32 | 8.716 | -14,64 | ||||
| 2026-02-13 | 13F | Smith Partners Wealth Management, LLC | 854 | 214 | ||||||
| 2026-02-12 | 13F | Chilton Capital Management Llc | 9 | 2 | ||||||
| 2026-02-13 | 13F | Dynamic Technology Lab Private Ltd | 2.772 | 695 | ||||||
| 2026-02-17 | 13F | Guardian Wealth Advisors, Llc / Nc | 1.786 | -0,22 | 448 | -12,67 | ||||
| 2025-09-25 | NP | DVRAX - MFS Global Alternative Strategy Fund A | 211 | 22,67 | 55 | 31,71 | ||||
| 2026-02-05 | 13F | Baader Bank INC | 0 | -100,00 | 0 | |||||
| 2026-02-12 | 13F | Beck Mack & Oliver Llc | 627.037 | 2,65 | 157.311 | -10,29 | ||||
| 2026-02-17 | 13F | Creative Planning | 15.891 | -5,40 | 3.987 | -17,34 | ||||
| 2025-09-26 | NP | BlackRock Funds II - BlackRock Dynamic High Income Portfolio Investor A This fund is a listed as child fund of BlackRock, Inc. and if that institution has disclosed ownership in this security, then these positions will not be double counted when calculating total shares and total value | 211 | 46,53 | 55 | 58,82 | ||||
| 2026-02-20 | 13F | Sunbelt Securities, Inc. | 0 | -100,00 | 0 | -100,00 | ||||
| 2026-01-29 | 13F | Teachers Retirement System Of The State Of Kentucky | 6.543 | 0,00 | 2 | 0,00 | ||||
| 2026-02-17 | 13F | Boothbay Fund Management, Llc | 2.335 | 586 | ||||||
| 2026-01-21 | 13F | McElhenny Sheffield Capital Management, LLC | 0 | -100,00 | 0 | |||||
| 2026-02-03 | 13F | Orion Capital Management LLC | 100 | 0,00 | 25 | -10,71 | ||||
| 2026-02-17 | 13F | Voleon Capital Management Lp | 0 | -100,00 | 0 | |||||
| 2026-02-13 | 13F | Baltimore-Washington Financial Advisors, Inc. | 894 | 1,02 | 224 | -11,46 | ||||
| 2026-01-27 | 13F | Forum Financial Management, LP | 2.837 | 0,57 | 712 | -12,11 | ||||
| 2026-02-17 | 13F | FIL Ltd | 2.839 | -42,54 | 712 | -49,79 | ||||
| 2026-02-17 | 13F | Utah Retirement Systems | 13.847 | 0,00 | 3.474 | -12,61 | ||||
| 2026-02-13 | 13F | National Bank Of Canada /fi/ | 35.925 | 60,35 | 9.012 | 40,13 | ||||
| 2026-02-17 | 13F | Df Dent & Co Inc | 0 | -100,00 | 0 | |||||
| 2025-09-26 | NP | TIEIX - TIAA-CREF Equity Index Fund Institutional Class | 69.669 | 0,00 | 18.120 | 7,92 | ||||
| 2026-01-20 | 13F | Stratos Wealth Partners, LTD. | 2.037 | 11,98 | 511 | -2,11 | ||||
| 2026-01-26 | 13F | Mirae Asset Global Investments Co., Ltd. | 15.191 | 21,12 | 3.811 | 5,86 | ||||
| 2026-02-04 | 13F | Hartford Investment Management Co | 4.774 | -1,77 | 1.198 | -14,19 | ||||
| 2025-09-25 | NP | DFUSX - U.s. Large Company Portfolio This fund is a listed as child fund of Dimensional Fund Advisors Lp and if that institution has disclosed ownership in this security, then these positions will not be double counted when calculating total shares and total value | 20.179 | -1,94 | 5.248 | 5,83 | ||||
| 2026-02-14 | 13F | Whipplewood Advisors, LLC | 4 | 1 | ||||||
| 2025-09-26 | NP | INVESCO ACTIVELY MANAGED EXCHANGE-TRADED FUND TRUST - Invesco S&P 500 Equal Weight Income Advantage ETF | 2.353 | 22,17 | 612 | 31,68 | ||||
| 2026-02-10 | 13F | Connor, Clark & Lunn Investment Management Ltd. | 0 | -100,00 | 0 | |||||
| 2025-11-14 | 13F | WealthTrak Capital Management LLC | 0 | -100,00 | 0 | |||||
| 2026-02-12 | 13F/A | Pinebridge Investments Llc | 33.627 | 8.436 | ||||||
| 2026-01-28 | 13F | First Financial Group Corp | 14.695 | -0,01 | 3.687 | -12,61 | ||||
| 2026-02-23 | 13F | Mv Capital Management, Inc. | 68 | -6,85 | 17 | -10,53 | ||||
| 2026-02-12 | 13F | Cibc World Markets Corp | 15.179 | 3.808 | ||||||
| 2026-01-23 | 13F | Optima Capital Llc | 4 | 1 | ||||||
| 2026-02-09 | 13F | Atlantic Trust, LLC | 19 | -20,83 | 5 | -33,33 | ||||
| 2026-02-06 | 13F | EverSource Wealth Advisors, LLC | 1.248 | -9,76 | 313 | -21,16 | ||||
| 2026-02-11 | 13F | Capital Analysts, Inc. | 16.005 | -0,62 | 4 | 0,00 | ||||
| 2025-11-14 | 13F | AXA Investment Managers S.A. | 10.078 | 2.893 | ||||||
| 2025-09-26 | NP | USSPX - 500 Index Fund -Member Shares | 20.403 | -0,93 | 5.306 | 6,91 | ||||
| 2026-02-03 | 13F | Ethic Inc. | 12.626 | 13,16 | 3.168 | -1,12 | ||||
| 2025-09-29 | NP | LOGSX - Live Oak Health Sciences Fund | 6.529 | 0,00 | 1.698 | 7,95 | ||||
| 2026-02-11 | 13F | Janney Montgomery Scott LLC | 33.818 | -1,67 | 8 | -11,11 | ||||
| 2026-02-11 | 13F | Rise Advisors, LLC | 0 | -100,00 | 0 | |||||
| 2026-01-27 | 13F | Vision Capital Management, Inc. | 0 | -100,00 | 0 | |||||
| 2026-02-17 | 13F | 2Xideas AG | 13.467 | -35,47 | 3.379 | -43,61 | ||||
| 2025-09-25 | NP | WELLS FARGO MASTER TRUST - Wells Fargo C&B Large Cap Value Portfolio C&B Large Cap Value Portfolio | 17.518 | -10,72 | 4.556 | -3,64 | ||||
| 2025-11-12 | 13F | Burgundy Asset Management Ltd. | 93.448 | -2,50 | 25.978 | 3,25 | ||||
| 2026-02-17 | 13F | Credit Agricole S A | 7.578 | -74,17 | 1.901 | -77,43 | ||||
| 2026-02-11 | 13F | Allianz Asset Management GmbH | 242.588 | 12,53 | 60.860 | -1,65 | ||||
| 2026-02-12 | 13F | Integrated Quantitative Investments LLC | 4.365 | 1.095 | ||||||
| 2026-02-13 | 13F | Seneschal Advisors, LLC | 2 | 0,00 | 1 | |||||
| 2026-01-23 | 13F | Sunpointe, LLC | 962 | -3,80 | 241 | -15,73 | ||||
| 2026-01-23 | 13F | Patton Fund Management, Inc. | 874 | -9,34 | 219 | -20,65 | ||||
| 2026-01-13 | 13F | Mather Group, Llc. | 1.037 | -4,69 | 260 | -16,67 | ||||
| 2026-01-21 | 13F | SJS Investment Consulting Inc. | 12 | -85,71 | 3 | -87,50 | ||||
| 2026-02-06 | 13F | Vestmark Advisory Solutions, Inc. | 1.048 | -43,53 | 263 | -50,75 | ||||
| 2026-02-04 | 13F | Oregon Public Employees Retirement Fund | 9.502 | 0,24 | 2.384 | -12,42 | ||||
| 2026-02-20 | 13F | Kovitz Investment Group Partners, LLC | 0 | -100,00 | 0 | |||||
| 2026-01-20 | 13F | American National Bank | 51.288 | 2,29 | 12.867 | -10,60 | ||||
| 2025-09-25 | NP | JMNAX - JPMorgan Research Market Neutral Fund Class A | Short | -1.722 | 11,82 | -448 | 20,49 | |||
| 2026-02-06 | 13F | Tortoise Investment Management, LLC | 0 | -100,00 | 0 | |||||
| 2026-02-17 | 13F | Alpine Woods Capital Investors, Llc | 8.240 | -18,49 | 2.067 | -28,75 | ||||
| 2025-09-29 | NP | AFAVX - AMG River Road Focused Absolute Value Fund CLASS I SHARES | 3.773 | -42,44 | 981 | -37,87 | ||||
| 2026-01-08 | 13F | Cooper Financial Group | 4.258 | -3,25 | 1.068 | -15,44 | ||||
| 2026-01-07 | 13F | Fragasso Group Inc. | 7.207 | -3,27 | 1.808 | -12,41 | ||||
| 2026-02-12 | 13F | BlackRock, Inc. | 6.540.781 | -19,50 | 1.640.951 | -29,65 | ||||
| 2025-11-03 | 13F | J. Safra Sarasin Holding AG | 0 | -100,00 | 0 | |||||
| 2026-01-30 | 13F | Us Bancorp \de\ | 20.193 | -4,98 | 5.066 | -16,97 | ||||
| 2025-09-26 | NP | FNILX - Fidelity ZERO Large Cap Index Fund This fund is a listed as child fund of Fmr Llc and if that institution has disclosed ownership in this security, then these positions will not be double counted when calculating total shares and total value | 21.430 | 4,03 | 5.574 | 12,27 | ||||
| 2026-02-13 | 13F | Ossiam | 0 | -100,00 | 0 | |||||
| 2026-02-11 | 13F | Winnow Wealth Llc | 3 | -90,00 | 1 | -100,00 | ||||
| 2026-02-09 | 13F | Mondrian Investment Partners LTD | 117.165 | -55,28 | 29.394 | -60,92 | ||||
| 2026-02-13 | 13F | Bank Of Nova Scotia | 14.376 | 23,38 | 3.607 | 7,83 | ||||
| 2025-09-26 | NP | JHMM - John Hancock Multifactor Mid Cap ETF | 52.577 | 0,16 | 13.674 | 8,09 | ||||
| 2026-02-10 | 13F | Marshall & Sterling Wealth Advisors Inc. | 278 | 0,36 | 70 | -12,66 | ||||
| 2025-09-29 | NP | CAMWX - Cambiar Opportunity Fund Institutional Class Shares | 35.500 | -35,45 | 9.233 | -30,35 | ||||
| 2026-01-28 | 13F | SP Asset Management LLC | 14.250 | 0,26 | 3.575 | -12,38 | ||||
| 2025-11-14 | 13F | ExodusPoint Capital Management, LP | 0 | -100,00 | 0 | |||||
| 2025-09-26 | NP | BKDV - BNY Mellon Dynamic Value ETF | 16.219 | 21,01 | 4.218 | 30,59 | ||||
| 2026-01-27 | 13F | Gf Fund Management Co. Ltd. | 2.286 | -1,80 | 574 | -14,22 | ||||
| 2026-02-17 | 13F | National Asset Management, Inc. | 828 | 9,52 | 208 | -4,17 | ||||
| 2026-02-03 | 13F | Ballentine Partners, LLC | 1.150 | -4,56 | 289 | -16,52 | ||||
| 2026-02-17 | 13F | MIRAE ASSET GLOBAL ETFS HOLDINGS Ltd. | 12.275 | 2,90 | 3.080 | -10,08 | ||||
| 2026-02-10 | 13F | Intech Investment Management Llc | 2.983 | 0,91 | 748 | -11,79 | ||||
| 2026-02-02 | 13F | Cornerstone Planning Group LLC | 60 | -1,64 | 16 | 6,67 | ||||
| 2026-02-17 | 13F | XTX Topco Ltd | 6.725 | 1.687 | ||||||
| 2025-09-29 | NP | RSP - Invesco S&P 500 Equal Weight ETF This fund is a listed as child fund of Invesco Ltd. and if that institution has disclosed ownership in this security, then these positions will not be double counted when calculating total shares and total value | 543.545 | -8,53 | 141.365 | -1,29 | ||||
| 2026-02-04 | 13F | Plato Investment Management Ltd | 5 | 0,00 | 1 | 0,00 | ||||
| 2026-01-26 | 13F | Whittier Trust Co Of Nevada Inc | 65 | 0,00 | 17 | -11,11 | ||||
| 2026-02-10 | 13F | Bridges Investment Management Inc | 5.524 | 0,00 | 1.386 | -12,62 | ||||
| 2025-11-12 | 13F | Barclays Plc | Call | 0 | -100,00 | 0 | -100,00 | |||
| 2026-02-17 | 13F | Raymond James Financial Inc | 117.095 | -11,74 | 29.377 | -22,86 | ||||
| 2026-01-20 | 13F | Cohen Capital Management, Inc. | 14.896 | 0,00 | 3.737 | -12,61 | ||||
| 2026-02-13 | 13F | Pathstone Holdings, LLC | 11.369 | -16,47 | 2.852 | -27,00 | ||||
| 2026-02-09 | 13F | Roundview Capital LLC | 5.981 | 2,82 | 1.501 | -10,13 | ||||
| 2026-02-11 | 13F | LPL Financial LLC | 53.109 | 7,16 | 13.324 | -6,35 | ||||
| 2026-02-04 | 13F | Midwest Trust Co | 52.535 | -0,77 | 13.180 | -13,28 | ||||
| 2025-09-26 | NP | FLPSX - Fidelity Low-Priced Stock Fund This fund is a listed as child fund of Fmr Llc and if that institution has disclosed ownership in this security, then these positions will not be double counted when calculating total shares and total value | 630.508 | -0,94 | 163.983 | 6,89 | ||||
| 2026-02-11 | 13F | Hughes Financial Services, LLC | 38 | 5,56 | 10 | 0,00 | ||||
| 2026-02-11 | 13F | VeraBank, N.A. | 0 | -100,00 | 0 | |||||
| 2026-02-09 | 13F | Smithfield Trust Co | 467 | 0,00 | 0 | |||||
| 2026-02-11 | 13F | Hilton Head Capital Partners, LLC | 107 | 27 | ||||||
| 2025-09-26 | NP | PEOPX - BNY Mellon S&P 500 Index Fund | 3.914 | 0,00 | 1.018 | 7,85 | ||||
| 2026-01-15 | 13F | McGlone Suttner Wealth Management, Inc. | 1.003 | 0,50 | 252 | -12,24 | ||||
| 2026-02-10 | 13F | Natixis Advisors, L.p. | 364.387 | -4,65 | 91 | -16,51 | ||||
| 2026-02-17 | 13F | Janus Henderson Group Plc | 129.083 | 0,13 | 32.385 | -12,49 | ||||
| 2026-02-17 | 13F | Balyasny Asset Management Llc | 45.400 | -61,61 | 11.390 | -66,45 | ||||
| 2026-01-16 | 13F | Trust Co Of Vermont | 2.304 | -4,12 | 578 | -16,11 | ||||
| 2026-01-23 | 13F | Assetmark, Inc | 71.373 | 3,39 | 17.906 | -9,64 | ||||
| 2026-02-03 | 13F | Farmers & Merchants Investments Inc | 244 | 0,00 | 61 | -12,86 | ||||
| 2026-01-13 | 13F | Trust Asset Management LLC | 933 | -4,31 | 234 | -16,13 | ||||
| 2026-02-12 | 13F | Brown Brothers Harriman & Co | 924 | 1,87 | 232 | -11,15 | ||||
| 2026-01-08 | 13F | Versant Capital Management, Inc | 800 | 252,42 | 201 | 207,69 | ||||
| 2026-01-09 | 13F | Park Place Capital Corp | 143 | 23,28 | 36 | 6,06 | ||||
| 2026-02-13 | 13F | Alamea Verwaltungs GmbH | 2.689 | 730 | ||||||
| 2026-01-20 | 13F | Thurston, Springer, Miller, Herd & Titak, Inc. | 105 | 26 | ||||||
| 2025-09-26 | NP | BOBP - CORE16 Best of Breed Premier Index ETF | 402 | 105 | ||||||
| 2026-02-17 | 13F | Capstone Investment Advisors, Llc | 0 | -100,00 | 0 | -100,00 | ||||
| 2026-02-12 | 13F | Bradley Foster & Sargent Inc/ct | 7.769 | 0,00 | 1.949 | -12,60 | ||||
| 2026-02-17 | 13F | Capstone Investment Advisors, Llc | Put | 0 | -100,00 | 0 | -100,00 | |||
| 2026-01-05 | 13F | Coastline Trust Co | 60 | 0,00 | 15 | -11,76 | ||||
| 2026-02-04 | 13F | Hallmark Capital Management Inc | 72 | 18 | ||||||
| 2026-02-13 | 13F | Storgate, LLC | 2.710 | 680 | ||||||
| 2025-11-12 | 13F | Neo Ivy Capital Management | 0 | -100,00 | 0 | |||||
| 2026-02-13 | 13F | Kayne Anderson Rudnick Investment Management Llc | 13 | 0,00 | 3 | 0,00 | ||||
| 2026-02-05 | 13F | Peak Asset Management, LLC | 1.785 | -6,89 | 448 | -18,73 | ||||
| 2025-11-12 | 13F | Arete Wealth Advisors, LLC | 0 | -100,00 | 0 | |||||
| 2026-01-23 | 13F | Rsm Us Wealth Management Llc | 6.098 | 12,32 | 1.543 | -0,96 | ||||
| 2026-02-10 | 13F | Sfmg, Llc | 1.494 | -0,20 | 375 | -12,82 | ||||
| 2026-02-17 | 13F | Strategic Investment Advisors / MI | 998 | -4,04 | 250 | -16,11 | ||||
| 2025-09-29 | NP | XYLG - Global X S&P 500 Covered Call & Growth ETF This fund is a listed as child fund of Mirae Asset Global Investments Co., Ltd. and if that institution has disclosed ownership in this security, then these positions will not be double counted when calculating total shares and total value | 85 | -15,84 | 22 | -8,33 | ||||
| 2026-02-09 | 13F | Legal & General Group Plc | 673.232 | -2,37 | 168.900 | -14,68 | ||||
| 2026-01-15 | 13F | Foster & Motley Inc | 5.227 | -13,75 | 1 | 0,00 | ||||
| 2026-02-10 | 13F | Essex Financial Services, Inc. | 2.737 | 11,31 | 687 | -2,70 | ||||
| 2026-02-05 | 13F | Leeward Investments, LLC - MA | 45.346 | -5,41 | 11.376 | -17,33 | ||||
| 2026-02-13 | 13F | Citigroup Inc | 98.493 | 51,93 | 24.710 | 32,78 | ||||
| 2026-02-13 | 13F | Manufacturers Life Insurance Company, The | 0 | -100,00 | 0 | |||||
| 2025-10-15 | 13F | Stephens Consulting, LLC | 0 | -100,00 | 0 | |||||
| 2026-01-22 | 13F | Bartlett & Co. Wealth Management Llc | 206.961 | -0,60 | 51.923 | -13,13 | ||||
| 2026-02-09 | 13F | 44 Wealth Management Llc | 0 | -100,00 | 0 | |||||
| 2026-02-12 | 13F | Grey Fox Wealth Advisors, LLC | 0 | -100,00 | 0 | |||||
| 2026-02-06 | 13F | BOK Financial Private Wealth, Inc. | 53 | 43,24 | 13 | 30,00 | ||||
| 2026-02-13 | 13F | Bridgefront Capital, LLC | 0 | -100,00 | 0 | |||||
| 2026-02-17 | 13F | Twinbeech Capital Lp | 3.525 | -88,14 | 884 | -89,64 | ||||
| 2025-09-25 | NP | EIVAX - Wells Fargo Classic Value Fund (fka Wells Fargo Intrinsic Value Fund) Class A | 225.889 | 19,91 | 58.749 | 29,40 | ||||
| 2026-02-10 | 13F | Easterly Investment Partners Llc | 30.268 | 7.594 | ||||||
| 2026-02-17 | 13F | Rexford Capital Inc | 745 | 0,00 | 187 | -12,68 | ||||
| 2025-09-26 | NP | FLCOX - Fidelity Large Cap Value Index Fund This fund is a listed as child fund of Fmr Llc and if that institution has disclosed ownership in this security, then these positions will not be double counted when calculating total shares and total value | 34.426 | -6,02 | 8.954 | 1,42 | ||||
| 2026-03-03 | 13F/A | Caitong International Asset Management Co., Ltd | 739 | 2.979,17 | 185 | 2.983,33 | ||||
| 2026-02-12 | 13F | Pitcairn Co | 0 | -100,00 | 0 | |||||
| 2026-02-10 | 13F | Acadian Asset Management Llc | 0 | -100,00 | 0 | |||||
| 2026-01-08 | 13F | True Wealth Design, LLC | 30 | 66,67 | 7 | 40,00 | ||||
| 2026-02-06 | 13F | Tredje AP-fonden | 9.497 | 0,00 | 2.383 | -12,62 | ||||
| 2025-09-26 | NP | BLPIX - Bull Profund Investor Class | 57 | -10,94 | 15 | -6,67 | ||||
| 2026-02-11 | 13F | Jessup Wealth Management, Inc | 26 | 7 | ||||||
| 2026-01-23 | 13F | Live Oak Private Wealth LLC | 949 | 0,00 | 238 | -12,50 | ||||
| 2026-01-21 | 13F | Modera Wealth Management, LLC | 1.499 | -0,46 | 376 | -12,96 | ||||
| 2026-01-08 | 13F | Grove Bank & Trust | 3.449 | 4,26 | 865 | -8,85 | ||||
| 2026-02-10 | 13F | Bnp Paribas Arbitrage, Sa | 253.352 | 125,24 | 63.561 | 96,85 | ||||
| 2026-02-10 | 13F | National Pension Service | 170.730 | 3,80 | 42.833 | -9,28 | ||||
| 2026-02-09 | 13F | Allstate Corp | 6.500 | 78,72 | 1.631 | 56,13 | ||||
| 2026-02-17 | 13F | Fairscale Capital, LLC | 166 | 0,00 | 42 | -12,77 | ||||
| 2026-01-27 | 13F | Shayne & Co., Llc | 9.110 | 0,00 | 2.286 | -12,62 | ||||
| 2026-01-23 | 13F | Sage Mountain Advisors LLC | 0 | -100,00 | 0 | |||||
| 2026-02-13 | 13F | Entropy Technologies, LP | 16.872 | 4.233 | ||||||
| 2026-02-17 | 13F | State Of Wisconsin Investment Board | 43.040 | -7,16 | 10.798 | -18,86 | ||||
| 2026-02-02 | 13F | PKO Investment Management Joint-Stock Co | 1.000 | 66,67 | 251 | 45,35 | ||||
| 2026-02-04 | 13F | Securian Asset Management, Inc | 2.244 | -44,55 | 563 | -51,59 | ||||
| 2026-02-17 | 13F | Hilltop Holdings Inc. | 1.631 | 2,58 | 409 | -10,31 | ||||
| 2026-01-13 | 13F | Trust Point Inc. | 1.415 | -1,94 | 355 | -14,49 | ||||
| 2026-02-13 | 13F | Wealth Alliance | 816 | -13,74 | 205 | -24,72 | ||||
| 2026-01-27 | 13F | Lecap Asset Management Ltd | 3.087 | 774 | ||||||
| 2026-01-29 | 13F | St Germain D J Co Inc | 7 | 0,00 | 2 | -50,00 | ||||
| 2026-02-13 | 13F | USS Investment Management Ltd | 13.440 | 0,00 | 3.373 | -12,59 | ||||
| 2026-02-13 | 13F | Baird Financial Group, Inc. | 4.197 | -75,94 | 1.053 | -78,99 |