Basisstatistiken
| Institutionelle Aktien (Long) | 664.430.766 - 95,57% (ex 13D/G) - change of -89,67MM shares -11,80% MRQ |
| Institutioneller Wert (Long) | $ 10.351.673 USD ($1000) |
Institutioneller Eigentümerschaft und Aktionäre
Healthpeak Properties, Inc. (US:PEAK) hat 790 institutionelle Eigentümer und Aktionäre, die 13D/G oder 13F Formulare bei der Securities Exchange Commission (SEC) eingereicht haben. Diese Institutionen halten insgesamt 664,430,766 Aktien. Die größten Aktionäre sind Vanguard Group Inc, BlackRock, Inc., State Street Corp, Jpmorgan Chase & Co, Fuller & Thaler Asset Management, Inc., Principal Financial Group Inc, Geode Capital Management, Llc, Invesco Ltd., Morgan Stanley, and Charles Schwab Investment Management Inc .
Healthpeak Properties, Inc. (NYSE:PEAK) Die institutionelle Eigentümerstruktur zeigt die aktuellen Positionen von Institutionen und Fonds im Unternehmen sowie die jüngsten Veränderungen der Positionsgröße. Zu den Großaktionären können Einzelanleger, Investmentfonds, Hedgefonds oder Institutionen gehören. Der Schedule 13D zeigt an, dass der Investor mehr als 5% des Unternehmens hält (oder gehalten hat) und beabsichtigt (oder beabsichtigt hat), aktiv eine Änderung der Geschäftsstrategie zu verfolgen. Schedule 13G zeigt eine passive Investition von über 5% an.

Fondsstimmung-Score
Der Fondsstimmung-Score (auch bekannt als Eigentümer-Akkumulations-Score) ermittelt die Aktien, die am meisten von Fonds gekauft werden. Er ist das Ergebnis eines ausgeklügelten quantitativen Multifaktormodells, das die Unternehmen mit den höchsten institutionellen Käufen identifiziert. Das Scoring-Modell verwendet eine Kombination aus der Gesamtzunahme der offengelegten Eigentümer, den Änderungen der Portfolioallokationen in diesen Eigentümern und anderen Metriken. Die Zahl reicht von 0 bis 100, wobei höhere Zahlen ein höheres Maß an Kapitalakkumulation als bei anderen Unternehmen anzeigen und 50 den Durchschnitt darstellt.
Aktualisierungshäufigkeit: Täglich
Siehe Ownership Explorer, der eine Liste der am höchsten bewerteten Unternehmen enthält.
AI+ Ask Fintel’s AI assistant about Healthpeak Properties, Inc..
Select a question to share a public post with an AI-crafted answer.
Thinking of good questions…
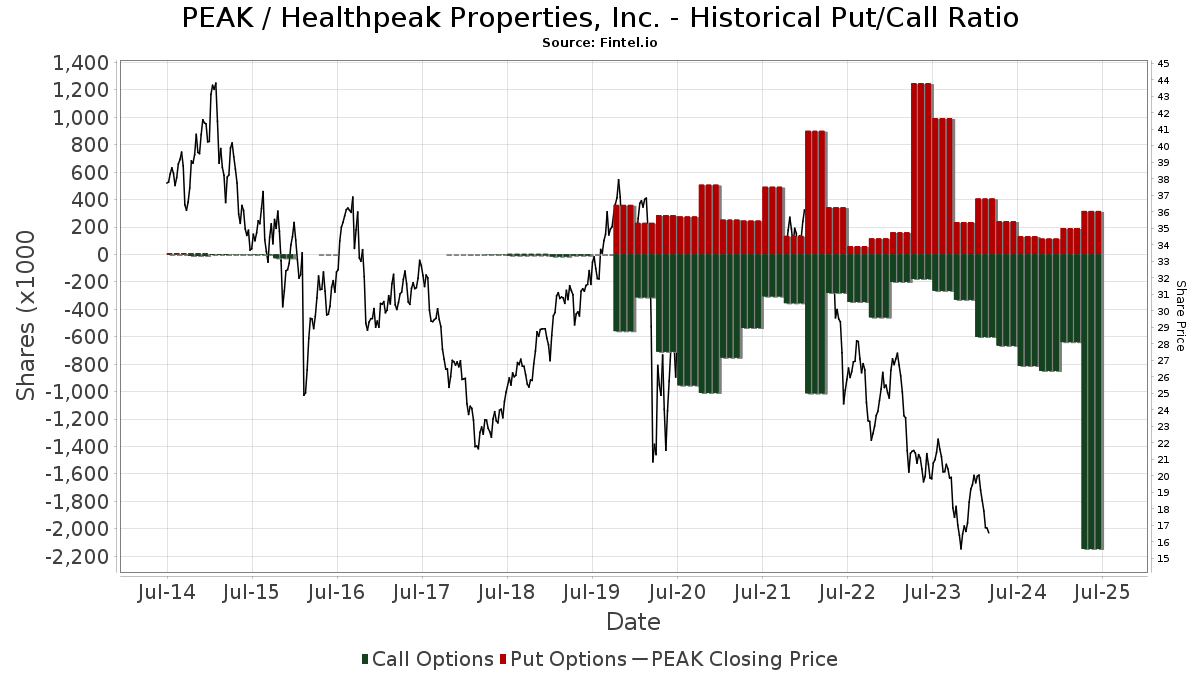
Institutionelles Put/Call-Verhältnis
Zusätzlich zur Meldung der Standardemissionen von Aktien und Schuldtiteln müssen Institute mit einem verwalteten Vermögen von mehr als 100 Mio. EUR auch ihre Bestände an Verkaufs- und Kaufoptionen offenlegen. Da Put-Optionen im Allgemeinen eine negative Stimmung und Call-Optionen eine positive Stimmung anzeigen, können wir uns ein Bild von der allgemeinen institutionellen Stimmung machen, indem wir das Verhältnis von Puts zu Calls aufzeichnen. Das Diagramm auf der rechten Seite zeigt das historische Put/Call-Verhältnis für dieses Instrument.
Die Verwendung des Put/Call-Verhältnisses als Indikator für die Anlegerstimmung überwindet einen der Hauptmängel der Verwendung des gesamten institutionellen Besitzes, der darin besteht, dass ein erheblicher Teil des verwalteten Vermögens passiv investiert wird, um Indizes abzubilden. Passiv verwaltete Fonds kaufen in der Regel keine Optionen, so dass der Indikator Put/Call-Verhältnis die Stimmung der aktiv verwalteten Fonds besser widerspiegelt.
13F und NPORT Einreichungen
Details zu 13F-Einreichungen sind kostenlos. Für Details zu NP-Einreichungen ist eine Premium-Mitgliedschaft erforderlich. Grüne Zeilen zeigen neue Positionen an. Rote Zeilen zeigen geschlossene Positionen an. Klicken Sie auf das Link Symbol, um den gesamten Transaktionsverlauf zu sehen.
Upgrade
um Prämiendaten freizuschalten und nach Excel zu exportieren ![]() .
.
Important Note
In an effort to reduce load times for our mobile users, we are testing some ways to deliver lighter pages.
In this first test, we will deliver only the most recent 750 transactions (out of 978 for this stock). If you are interested in loading *all* the transactions for this company, click the "load all" button below. This is just a test and if you don't like it, please let us know by submitting some gentle feedback via the link at the bottom of this page.
Load All| Datei Datum | Quelle | Anleger | Typ | Durchschnittlicher Preis (Est) |
Aktien | Δ Aktien (%) |
Gemeldeter Wert ($1000) |
Δ Wert (%) |
Port Alloc (%) |
|
|---|---|---|---|---|---|---|---|---|---|---|
| 2026-01-05 | 13F | GoalVest Advisory LLC | 1.501 | 24 | ||||||
| 2026-02-11 | 13F | Fjarde Ap-fonden /fourth Swedish National Pension Fund | 101.000 | 1.624 | ||||||
| 2026-02-03 | 13F | Crossmark Global Holdings, Inc. | 29.266 | 16,32 | 471 | -2,29 | ||||
| 2026-01-28 | 13F | Teacher Retirement System Of Texas | 23.027 | -74,71 | 370 | -78,77 | ||||
| 2026-02-10 | 13F | Principia Wealth Advisory, LLC | 101 | 3,06 | 2 | 0,00 | ||||
| 2026-02-12 | 13F | Raiffeisen Bank International AG | 828 | 0,00 | 13 | -13,33 | ||||
| 2026-02-10 | 13F | Mutual Of America Capital Management Llc | 240.390 | 5,68 | 3.865 | -11,25 | ||||
| 2026-02-04 | 13F | HighPoint Advisor Group LLC | 21.737 | -24,52 | 350 | -36,66 | ||||
| 2026-02-10 | 13F | Daiwa Securities Group Inc. | 383.093 | 4,75 | 6 | -14,29 | ||||
| 2026-02-13 | 13F | Kilter Group LLC | 50 | -23,08 | 1 | -100,00 | ||||
| 2026-02-10 | 13F | Novak & Powell Financial Services, Inc. | 11.845 | 1,77 | 190 | -14,41 | ||||
| 2026-02-17 | 13F | Susquehanna International Group, Llp | Call | 105.000 | -74,24 | 1.688 | -78,37 | |||
| 2026-02-17 | 13F | Susquehanna International Group, Llp | 714.394 | 338,54 | 11.487 | 268,29 | ||||
| 2026-02-17 | 13F | Susquehanna International Group, Llp | Put | 1.034.900 | 80,52 | 16.641 | 51,58 | |||
| 2026-02-17 | 13F | Greenland Capital Management LP | Call | 54.000 | 868 | |||||
| 2026-01-26 | 13F | Provenance Wealth Advisors, LLC | 11.399 | 0,00 | 183 | -16,06 | ||||
| 2026-02-12 | 13F | Keynote Financial Services Llc | 12.192 | -5,25 | 196 | -20,33 | ||||
| 2026-02-13 | 13F | Ossiam | 50.915 | -18,96 | 819 | -32,00 | ||||
| 2026-02-02 | 13F | Caisse Des Depots Et Consignations | 56.774 | 13,15 | 913 | -5,00 | ||||
| 2026-02-13 | 13F | Great West Life Assurance Co /can/ | 1.436.748 | 1,17 | 23 | -11,54 | ||||
| 2026-02-13 | 13F | JustInvest LLC | 97.194 | -27,17 | 1.563 | -38,89 | ||||
| 2026-01-26 | 13F | Foster Victor Wealth Advisors, LLC | 403.580 | -3,01 | 7.196 | -10,73 | ||||
| 2026-02-11 | 13F | Los Angeles Capital Management Llc | 3.113 | 55 | ||||||
| 2026-02-12 | 13F | Commonwealth Equity Services, Llc | 493.686 | -12,55 | 7.938 | 79.280,00 | ||||
| 2026-01-09 | 13F | Diversified Trust Co | 0 | -100,00 | 0 | -100,00 | ||||
| 2025-09-29 | NP | XYLG - Global X S&P 500 Covered Call & Growth ETF This fund is a listed as child fund of Mirae Asset Global Investments Co., Ltd. and if that institution has disclosed ownership in this security, then these positions will not be double counted when calculating total shares and total value | 721 | -4,76 | 12 | -7,69 | ||||
| 2026-02-10 | 13F | Core Wealth Advisors, Llc | 19 | 0 | ||||||
| 2026-02-13 | 13F | Ontario Teachers Pension Plan Board | 0 | -100,00 | 0 | |||||
| 2026-02-02 | 13F | CENTRAL TRUST Co | 791 | 0,00 | 13 | -20,00 | ||||
| 2025-09-29 | NP | HCMT - Direxion HCM Tactical Enhanced US ETF | 5.168 | 22,73 | 88 | 16,00 | ||||
| 2026-02-13 | 13F | Colony Group, LLC | 233.840 | 313,49 | 3.760 | 247,18 | ||||
| 2026-01-05 | 13F | GAMMA Investing LLC | 6.889 | -62,88 | 111 | -69,01 | ||||
| 2026-02-11 | 13F | Janney Montgomery Scott LLC | 879.867 | -4,40 | 14 | -17,65 | ||||
| 2026-01-05 | 13F | Chesapeake Asset Management Llc | 0 | -100,00 | 0 | |||||
| 2026-01-20 | 13F | Hanson & Doremus Investment Management | 2.400 | 0,00 | 0 | |||||
| 2026-02-11 | 13F | LPL Financial LLC | 4.940.167 | 3,22 | 79.438 | -13,33 | ||||
| 2026-02-10 | 13F | Presima Inc. | 373.942 | -40,59 | 6.013 | -50,12 | ||||
| 2025-11-14 | 13F | Binnacle Investments Inc | 8.594 | 4,21 | 165 | 13,89 | ||||
| 2026-02-13 | 13F | Edgestream Partners, L.P. | 0 | -100,00 | 0 | |||||
| 2026-01-14 | 13F | Exchange Traded Concepts, Llc | 8.171 | 5,12 | 131 | -11,49 | ||||
| 2026-02-11 | 13F | Nuance Investments, Llc | 143.054 | -11,44 | 2.300 | -25,64 | ||||
| 2026-02-13 | 13F | Parkside Financial Bank & Trust | 15.149 | -0,11 | 244 | -16,21 | ||||
| 2026-03-20 | 13F | Purpose Unlimited Inc. | 28.048 | 451 | ||||||
| 2026-02-13 | 13F | Candriam Luxembourg S.C.A. | 133.865 | 17,78 | 2.153 | -1,10 | ||||
| 2026-02-13 | 13F | Dockside LLC | 97.331 | 1.565 | ||||||
| 2026-02-11 | 13F | Ing Groep Nv | 92.016 | 317,48 | 1.480 | 250,47 | ||||
| 2025-11-12 | 13F | Sumitomo Life Insurance Co | 0 | -100,00 | 0 | |||||
| 2026-02-11 | 13F | Group One Trading, L.p. | Put | 16.600 | 22,96 | 267 | 3,10 | |||
| 2026-02-11 | 13F | Cerity Partners LLC | 158.641 | -9,81 | 2.551 | -24,29 | ||||
| 2026-02-09 | 13F | Coldstream Capital Management Inc | 23.280 | -32,81 | 374 | -43,59 | ||||
| 2026-01-29 | 13F | Dunhill Financial, LLC | 60 | 361,54 | 1 | |||||
| 2026-02-11 | 13F | Group One Trading, L.p. | Call | 29.400 | -73,91 | 473 | -78,13 | |||
| 2026-02-17 | 13F | DV Trading LLC | 1.000 | 16 | ||||||
| 2026-02-17 | 13F | Toronto Dominion Bank | 416.872 | -1,73 | 6.703 | -17,48 | ||||
| 2026-02-17 | 13F | Fmr Llc | 10.539.390 | 153,44 | 169.473 | 112,81 | ||||
| 2025-11-12 | 13F | Globeflex Capital L P | 0 | -100,00 | 0 | |||||
| 2025-09-29 | NP | QDPL - Pacer Metaurus US Large Cap Dividend Multiplier 400 ETF | 12.729 | 13,92 | 216 | 8,04 | ||||
| 2026-02-12 | 13F | Advisors Asset Management, Inc. | 34.417 | 553 | ||||||
| 2025-11-14 | 13F | WealthTrust Axiom LLC | 0 | -100,00 | 0 | |||||
| 2026-01-14 | 13F | Chris Bulman Inc | 0 | -100,00 | 0 | |||||
| 2026-02-17 | 13F | Wealth Watch Advisors, INC | 0 | -100,00 | 0 | |||||
| 2026-01-14 | 13F | Spire Wealth Management | 822 | -23,68 | 13 | -35,00 | ||||
| 2026-01-30 | 13F | Archer Investment Corp | 24.516 | 0,00 | 394 | -15,99 | ||||
| 2026-01-21 | 13F | Oak Thistle LLC | 244.925 | 3.938 | ||||||
| 2025-09-29 | NP | PTLC - Pacer Trendpilot US Large Cap ETF | 43.364 | -11,52 | 735 | -27,47 | ||||
| 2026-02-09 | 13F | Wiser Advisor Group LLC | 1.998 | 1,78 | 32 | -13,51 | ||||
| 2026-02-17 | 13F | Two Sigma Securities, Llc | 15.334 | 247 | ||||||
| 2026-01-29 | 13F | State Of Michigan Retirement System | 181.893 | -3,24 | 2.925 | -18,78 | ||||
| 2026-02-12 | 13F | JPL Wealth Management, LLC | 0 | -100,00 | 0 | |||||
| 2026-02-12 | 13F | Skandinaviska Enskilda Banken AB (publ) | 129.116 | -0,96 | 2.076 | -16,83 | ||||
| 2026-02-17 | 13F | NEOS Investment Management LLC | 187.818 | 30,06 | 3.020 | 9,22 | ||||
| 2026-02-13 | 13F | Marshall Wace, Llp | 1.240.091 | 19.941 | ||||||
| 2026-01-15 | 13F | Brookstone Capital Management | 628.491 | -4,43 | 10.106 | -19,75 | ||||
| 2026-01-21 | 13F | Clayton Financial Group LLC | 125 | 2 | ||||||
| 2026-02-05 | 13F | Arjuna Capital | 15.606 | 5,67 | 251 | -11,35 | ||||
| 2026-02-13 | 13F | BNP Paribas Asset Management Holding S.A. | 1.692.477 | 152,48 | 27 | 125,00 | ||||
| 2026-02-12 | 13F | State Board Of Administration Of Florida Retirement System | 649.775 | -0,03 | 10.448 | -16,06 | ||||
| 2026-02-13 | 13F | Truvestments Capital Llc | 392 | 0,00 | 6 | -14,29 | ||||
| 2026-02-17 | 13F | Brevan Howard Capital Management LP | 151.757 | 40,69 | 2.440 | 18,16 | ||||
| 2026-02-06 | 13F | Pathway Financial Advisers, LLC | 32.417 | 1,77 | 521 | -14,45 | ||||
| 2025-11-13 | 13F | Vinva Investment Management Ltd | 0 | -100,00 | 0 | |||||
| 2026-02-10 | 13F | Basepoint Wealth LLC | 130 | 2 | ||||||
| 2026-02-13 | 13F | Arkadios Wealth Advisors | 48.219 | -12,77 | 775 | -26,75 | ||||
| 2026-02-04 | 13F | Swiss Life Asset Management Ltd | 167.828 | 41,27 | 2.699 | 18,59 | ||||
| 2025-09-29 | NP | DRN - Direxion Daily MSCI Real Estate Bull 3X Shares | 28.560 | 2,07 | 484 | -3,21 | ||||
| 2026-02-17 | 13F | Mercer Global Advisors Inc /adv | 54.872 | 53,24 | 882 | 28,76 | ||||
| 2026-02-12 | 13F | APG Asset Management US Inc. | 1.980.187 | -12,90 | 31.841 | -26,97 | ||||
| 2026-02-10 | 13F | Impact Partnership Wealth, LLC | 16.548 | -9,17 | 266 | -23,56 | ||||
| 2026-02-13 | 13F | Centaurus Financial, Inc. | 11.896 | -39,75 | 0 | |||||
| 2026-01-30 | 13F | Samalin Investment Counsel, LLC | 0 | -100,00 | 0 | |||||
| 2026-02-10 | 13F | Root Financial Partners, LLC | 891 | 5,32 | 14 | -12,50 | ||||
| 2025-11-14 | 13F | Wetherby Asset Management Inc | 11.229 | 215 | ||||||
| 2026-01-14 | 13F | Romano Brothers And Company | 40.304 | -4,69 | 648 | -19,30 | ||||
| 2026-01-23 | 13F | Robeco Institutional Asset Management B.V. | 799.225 | -9,79 | 12.852 | -24,25 | ||||
| 2026-02-17 | 13F | Coppell Advisory Solutions LLC | 13.059 | -1,02 | 211 | -15,60 | ||||
| 2026-02-12 | 13F | Hm Payson & Co | 1.069 | 0,00 | 17 | -15,00 | ||||
| 2026-02-10 | 13F | WCG Wealth Advisors LLC | 13.859 | 223 | ||||||
| 2026-02-03 | 13F | Anfield Capital Management, LLC | 231 | 0,00 | 4 | -25,00 | ||||
| 2026-01-30 | 13F | Keybank National Association/oh | 120.494 | -41,99 | 1.938 | -51,29 | ||||
| 2026-02-12 | 13F | Loomis Sayles & Co L P | 3.536 | -1,78 | 57 | -17,65 | ||||
| 2026-01-28 | 13F | Mowery & Schoenfeld Wealth Management, LLC | 214 | 3 | ||||||
| 2026-01-15 | 13F | Retirement Systems of Alabama | 536.209 | -1,37 | 8.622 | -17,18 | ||||
| 2026-01-26 | 13F | Cwm, Llc | 37.685 | 18,00 | 1 | |||||
| 2026-02-13 | 13F | Resources Management Corp /ct/ /adv | 86.225 | 251,65 | 1 | |||||
| 2026-02-10 | 13F | Westpac Banking Corp | 178.189 | 0,00 | 2.865 | -16,03 | ||||
| 2025-10-27 | 13F | First Horizon Corp | 0 | -100,00 | 0 | |||||
| 2026-02-13 | 13F | Acumen Wealth Advisors, LLC | 41 | 1 | ||||||
| 2026-02-05 | 13F | Commerzbank Aktiengesellschaft /fi | 42.345 | 2,19 | 1 | |||||
| 2026-02-06 | 13F | Envestnet Portfolio Solutions, Inc. | 35.384 | -13,01 | 569 | -26,99 | ||||
| 2026-02-17 | 13F | DZ BANK AG Deutsche Zentral Genossenschafts Bank, Frankfurt am Main | 0 | -100,00 | 0 | |||||
| 2026-02-09 | 13F | MQS Management LLC | 15.928 | 256 | ||||||
| 2026-01-22 | 13F | V-Square Quantitative Management LLC | 25.021 | 5,46 | 402 | -11,45 | ||||
| 2026-01-30 | 13F | Sigma Planning Corp | 12.222 | -13,98 | 197 | -27,94 | ||||
| 2026-02-12 | 13F | Gould Capital, LLC | 800 | 0,00 | 13 | -20,00 | ||||
| 2026-02-17 | 13F | Sophron Capital Management L.P. | 173.245 | -20,63 | 2.786 | -33,37 | ||||
| 2026-02-17 | 13F | Aristotle Capital Boston, LLC | 144.028 | -9,15 | 2.316 | -23,72 | ||||
| 2026-01-29 | 13F | Quest 10 Wealth Builders, Inc. | 49 | -46,74 | 1 | -100,00 | ||||
| 2026-01-30 | 13F | Activest Wealth Management | 0 | -100,00 | 0 | |||||
| 2026-02-10 | 13F | Eurizon Capital SGR S.p.A. | 322.328 | 5.185 | ||||||
| 2026-02-13 | 13F | SRS Capital Advisors, Inc. | 6.834 | -41,48 | 110 | -51,12 | ||||
| 2026-02-13 | 13F | Wiregrass Investment Management Llc | 63.331 | 1.018 | ||||||
| 2026-01-14 | 13F | Eastern Bank | 450 | -62,34 | 7 | -68,18 | ||||
| 2026-01-23 | 13F | Private Wealth Management Group, LLC | 103 | -8,04 | 2 | -50,00 | ||||
| 2026-02-02 | 13F | Benjamin Edwards Inc | 12.243 | -28,38 | 197 | -40,06 | ||||
| 2026-02-17 | 13F | Norinchukin Bank, The | 69.005 | 0,52 | 1.110 | -15,60 | ||||
| 2026-03-04 | 13F | Rehmann Capital Advisory Group | 24.797 | 0,78 | 399 | -15,50 | ||||
| 2026-02-26 | 13F | Anchor Investment Management, LLC | 14.803 | 1,13 | 238 | -15,00 | ||||
| 2026-02-17 | 13F | Lighthouse Investment Partners, LLC | 391.474 | 6.295 | ||||||
| 2026-01-29 | 13F | Northern Oak Wealth Management Inc | 93.870 | 326,95 | 1.509 | 258,43 | ||||
| 2026-02-10 | 13F | REAP Financial Group, LLC | 2.113 | 8,92 | 34 | -10,81 | ||||
| 2026-02-10 | 13F | Moors & Cabot, Inc. | 21.563 | -15,66 | 347 | -29,24 | ||||
| 2026-02-17 | 13F | Aqr Capital Management Llc | 416.698 | 57,74 | 6.701 | 32,80 | ||||
| 2026-02-13 | 13F | Nfj Investment Group, Llc | 0 | -100,00 | 0 | |||||
| 2026-01-23 | 13F/A | HF Advisory Group, LLC | 93.743 | 1.507 | ||||||
| 2026-01-20 | 13F | Trust Co Of Toledo Na /oh/ | 118.735 | 44,05 | 1.909 | 20,98 | ||||
| 2025-10-21 | 13F | Tectonic Advisors Llc | 0 | -100,00 | 0 | -100,00 | ||||
| 2026-02-17 | 13F | WFA of San Diego, LLC | 0 | -100,00 | 0 | |||||
| 2026-02-17 | 13F | PharVision Advisers, LLC | 15.429 | 248 | ||||||
| 2026-02-17 | 13F | Dark Forest Capital Management Lp | 164.194 | 2.640 | ||||||
| 2026-02-02 | 13F | Danske Bank A/s | 409.880 | 5,92 | 6.591 | -11,07 | ||||
| 2026-02-06 | 13F | Diamant Asset Management, Inc. | 19.240 | 9,69 | 309 | -7,76 | ||||
| 2026-01-23 | 13F | Optima Capital Llc | 31 | 0 | ||||||
| 2026-02-06 | 13F | Fairtree Asset Management (Pty) Ltd | 40.297 | 1,09 | 648 | -15,20 | ||||
| 2026-02-17 | 13F | Advisor Group Holdings, Inc. | 302.459 | -7,51 | 4.864 | -21,41 | ||||
| 2026-02-04 | 13F | Clark Wealth Partners | 19 | 0,00 | 0 | |||||
| 2026-01-20 | 13F | Signaturefd, Llc | 18.653 | -19,54 | 300 | -32,51 | ||||
| 2026-02-03 | 13F | Mitsubishi UFJ Kokusai Asset Management Co., Ltd. | 2.014.003 | 4,06 | 32.627 | -11,97 | ||||
| 2026-01-30 | 13F | Oakworth Capital, Inc. | 452 | 7 | ||||||
| 2026-02-18 | 13F | Caitlin John, LLC | 6 | 0,00 | 0 | |||||
| 2026-02-06 | 13F | Resona Asset Management Co.,Ltd. | 404.992 | -4,29 | 6.506 | -19,26 | ||||
| 2025-11-10 | 13F | Jupiter Asset Management Ltd | 0 | -100,00 | 0 | -100,00 | ||||
| 2026-02-13 | 13F | Citigroup Inc | 1.560.195 | 28,24 | 25.088 | 7,67 | ||||
| 2026-02-04 | 13F | Fortem Financial Group, Llc | 0 | -100,00 | 0 | |||||
| 2025-09-29 | NP | XTR - Global X S&P 500 Tail Risk ETF This fund is a listed as child fund of Mirae Asset Global Investments Co., Ltd. and if that institution has disclosed ownership in this security, then these positions will not be double counted when calculating total shares and total value | 29 | 0,00 | 0 | |||||
| 2026-02-12 | 13F | Lansforsakringar Fondforvaltning AB (publ) | 217.722 | 0,00 | 3.501 | -16,05 | ||||
| 2025-11-04 | 13F | Winnow Wealth Llc | 0 | -100,00 | 0 | |||||
| 2026-01-12 | 13F | Kozak & Associates, Inc. | 0 | 0 | ||||||
| 2025-11-14 | 13F | Df Dent & Co Inc | 0 | -100,00 | 0 | |||||
| 2026-02-10 | 13F | Peapack Gladstone Financial Corp | 184.218 | -7,56 | 3 | -33,33 | ||||
| 2026-02-13 | 13F | Charles Schwab Investment Management Inc | 11.107.199 | 4,95 | 178.604 | -11,88 | ||||
| 2026-02-05 | 13F | Amalgamated Bank | 129.557 | -1,64 | 2 | 0,00 | ||||
| 2026-02-09 | 13F | Investors Portfolio Services LLC | 21 | 0 | ||||||
| 2026-01-29 | 13F | D.a. Davidson & Co. | 141.269 | -1,93 | 2.272 | -17,66 | ||||
| 2026-02-13 | 13F | Kempen Capital Management N.v. | 670.049 | -49,89 | 10.774 | -57,92 | ||||
| 2026-01-20 | 13F | Princeton Global Asset Management LLC | 187 | 1,63 | 3 | 0,00 | ||||
| 2026-02-17 | 13F | Clear Street Markets Llc | 1.031 | -14,01 | 17 | -27,27 | ||||
| 2026-01-29 | 13F | UMA Financial Services, Inc. | 113 | 2 | ||||||
| 2026-01-16 | 13F | Tema Etfs Llc | 12.545 | -0,29 | 202 | -16,25 | ||||
| 2026-02-09 | 13F | Key FInancial Inc | 553 | 0,00 | 9 | -20,00 | ||||
| 2026-01-27 | 13F | Proffitt & Goodson Inc | 0 | -100,00 | 0 | |||||
| 2026-02-11 | 13F | Vestcor Inc | 12.826 | 0,00 | 0 | |||||
| 2026-02-06 | 13F | IFP Advisors, Inc | 6.326 | -5,44 | 102 | -21,09 | ||||
| 2026-02-17 | 13F | Man Group plc | 655.060 | -4,04 | 10.533 | -19,42 | ||||
| 2026-02-17 | 13F | Gillson Capital LP | 1.029.091 | 17 | ||||||
| 2026-02-12 | 13F | BlackRock, Inc. | 73.542.587 | 0,74 | 1.182.565 | -15,41 | ||||
| 2026-02-13 | 13F | Toroso Investments, LLC | 34.227 | 61,53 | 550 | 35,80 | ||||
| 2026-02-13 | 13F | Neuberger Berman Group LLC | 82.159 | -5,13 | 1.321 | -20,33 | ||||
| 2026-02-13 | 13F | Cullen Capital Management, LLC | 9.247.344 | -9,63 | 148.697 | -24,12 | ||||
| 2025-11-07 | 13F | Sierra Ocean, Llc | 0 | -100,00 | 0 | -100,00 | ||||
| 2026-02-09 | 13F | Guinness Asset Management LTD | 6.307 | 56,97 | 101 | 32,89 | ||||
| 2026-02-06 | 13F | Motco | 6.972 | -1,94 | 112 | -17,65 | ||||
| 2026-02-04 | 13F | Pensionmark Financial Group, Llc | 0 | -100,00 | 0 | |||||
| 2026-02-20 | 13F | Sunbelt Securities, Inc. | 7.542 | -26,09 | 121 | -37,95 | ||||
| 2025-11-14 | 13F | WealthTrak Capital Management LLC | 0 | -100,00 | 0 | |||||
| 2026-01-23 | 13F | Legacy Bridge, LLC | 97 | 2 | ||||||
| 2026-02-17 | 13F | Creative Planning | 144.595 | -28,90 | 2.325 | -40,29 | ||||
| 2026-01-21 | 13F | Sound Income Strategies, LLC | 13.768 | 808,18 | 245 | 807,41 | ||||
| 2026-02-06 | 13F | GPS Wealth Strategies Group, LLC | 0 | -100,00 | 0 | |||||
| 2026-02-18 | 13F | Mackenzie Financial Corp | 64.195 | -46,52 | 1.037 | -54,92 | ||||
| 2026-01-09 | 13F | Assenagon Asset Management S.A. | 28.026 | 9,09 | 451 | -8,35 | ||||
| 2026-02-17 | 13F | Guggenheim Capital Llc | 241.141 | 1,71 | 3.878 | -14,60 | ||||
| 2026-02-17 | 13F | D. E. Shaw & Co., Inc. | 51.380 | 318,20 | 826 | 251,49 | ||||
| 2025-11-12 | 13F | Transce3nd, LLC | 0 | -100,00 | 0 | |||||
| 2026-01-12 | 13F | Pensionfund Sabic | 94.755 | -5,01 | 2 | -50,00 | ||||
| 2025-10-30 | 13F | Traub Capital Management LLC | 0 | -100,00 | 0 | -100,00 | ||||
| 2026-01-23 | 13F | State of Alaska, Department of Revenue | 411.381 | -0,61 | 7 | -14,29 | ||||
| 2026-02-13 | 13F | Integrated Wealth Concepts LLC | 13.388 | 215 | ||||||
| 2026-01-21 | 13F | Raleigh Capital Management Inc. | 6.058 | -0,08 | 97 | -16,38 | ||||
| 2026-02-02 | 13F | CX Institutional | 3.810 | -50,12 | 0 | |||||
| 2026-02-13 | 13F | Public Employees Retirement Association Of Colorado | 61.832 | 0,00 | 1 | -100,00 | ||||
| 2026-01-27 | 13F | Bayforest Capital Ltd | 20.788 | -27,71 | 334 | -39,27 | ||||
| 2026-02-05 | 13F | Intrua Financial, LLC | 65.958 | 4,22 | 1.061 | -12,47 | ||||
| 2026-02-17 | 13F | NewSquare Capital LLC | 159.375 | -28,25 | 2.563 | -39,76 | ||||
| 2026-02-05 | 13F | High Note Wealth, LLC | 209 | 127,17 | 3 | 200,00 | ||||
| 2025-11-14 | 13F | Qube Research & Technologies Ltd | 0 | -100,00 | 0 | |||||
| 2025-11-07 | 13F | Rialto Wealth Management, LLC | 0 | -100,00 | 0 | |||||
| 2026-02-06 | 13F | Meiji Yasuda Asset Management Co Ltd. | 0 | -100,00 | 0 | |||||
| 2026-02-10 | 13F | Kentucky Retirement Systems | 43.518 | 0,00 | 700 | -16,09 | ||||
| 2026-02-05 | 13F | Northwestern Mutual Investment Management Company, Llc | 22.204 | 0,25 | 357 | -15,80 | ||||
| 2026-02-13 | 13F | Bridgefront Capital, LLC | 12.451 | 200 | ||||||
| 2025-11-13 | 13F | Capital Fund Management S.a. | 0 | -100,00 | 0 | -100,00 | ||||
| 2026-01-20 | 13F | Global Trust Asset Management, LLC | 0 | -100,00 | 0 | -100,00 | ||||
| 2026-02-11 | 13F | MidWestOne Financial Group, Inc. | 0 | -100,00 | 0 | |||||
| 2026-02-17 | 13F | Price T Rowe Associates Inc /md/ | 1.017.493 | 0,71 | 16 | -15,79 | ||||
| 2026-02-17 | 13F | Aster Capital Management (DIFC) Ltd | 0 | -100,00 | 0 | |||||
| 2026-02-10 | 13F | Norges Bank | 9.549.137 | 153.550 | ||||||
| 2026-02-11 | 13F | Metis Global Partners, LLC | 269.493 | 2,67 | 4.333 | -13,79 | ||||
| 2026-01-20 | 13F | AdvisorNet Financial, Inc | 2.208 | -2,00 | 36 | -18,60 | ||||
| 2026-01-28 | 13F | Universal- Beteiligungs- und Servicegesellschaft mbH | 1.574.864 | -1,60 | 25.414 | -17,08 | ||||
| 2026-01-09 | 13F | SG Americas Securities, LLC | 1.155.041 | 2.416,70 | 19 | |||||
| 2026-02-19 | 13F | Invesco Ltd. | 18.298.776 | 9,90 | 294.244 | -7,72 | ||||
| 2026-02-04 | 13F | Virginia Retirement Systems Et Al | 320.040 | 176,04 | 5.146 | 131,80 | ||||
| 2026-01-14 | 13F | Woodward Diversified Capital, Llc | 11.301 | 4,36 | 182 | -12,56 | ||||
| 2026-02-11 | 13F | Simplex Trading, Llc | Call | 13.000 | -32,29 | 209 | ||||
| 2026-01-20 | 13F | Nvwm, Llc | 30 | 200,00 | 0 | |||||
| 2026-02-17 | 13F | Maryland State Retirement & Pension System | 35.035 | 0,00 | 563 | -15,97 | ||||
| 2026-02-11 | 13F | Simplex Trading, Llc | Put | 6.300 | -46,15 | 101 | ||||
| 2026-02-17 | 13F | Integrated Advisors Network LLC | 17.726 | 11,22 | 285 | -6,56 | ||||
| 2026-02-11 | 13F | Simplex Trading, Llc | 8.496 | 361,74 | 137 | |||||
| 2026-02-12 | 13F | Ensign Peak Advisors, Inc | 65.083 | -50,35 | 1.047 | -58,33 | ||||
| 2026-02-23 | 13F | Virtu Financial LLC | 57.008 | 1 | ||||||
| 2026-02-17 | 13F | Susquehanna Portfolio Strategies, LLC | 260.080 | -51,26 | 4.182 | -59,08 | ||||
| 2026-02-05 | 13F | Bank Julius Baer & Co. Ltd, Zurich | 2.200 | 0,00 | 35 | -16,67 | ||||
| 2026-02-17 | 13F | Woodline Partners LP | 118.571 | 29,10 | 1.907 | 8,42 | ||||
| 2025-11-14 | 13F | Cohen & Steers, Inc. | 0 | -100,00 | 0 | |||||
| 2025-10-24 | 13F | Hemington Wealth Management | 251 | 35,68 | 0 | |||||
| 2026-02-06 | 13F | ProShare Advisors LLC | 244.533 | 13,04 | 3.932 | -5,07 | ||||
| 2026-02-09 | 13F | William Blair Investment Management, Llc | 20.114 | -8,09 | 323 | -22,91 | ||||
| 2026-02-17 | 13F | Raymond James Financial Inc | 2.392.851 | 10,79 | 38.477 | -6,97 | ||||
| 2026-02-18 | 13F | State of Tennessee, Treasury Department | 159.416 | -1,31 | 2.748 | -11,15 | ||||
| 2026-01-07 | 13F | Aventura Private Wealth, LLC | 20 | 0 | ||||||
| 2026-02-17 | 13F | Magnetar Financial LLC | 17.197 | 277 | ||||||
| 2026-01-21 | 13F | Westfuller Advisors, LLC | 0 | -100,00 | 0 | |||||
| 2026-02-12 | 13F | SWAN Capital LLC | 265 | 0,00 | 4 | -20,00 | ||||
| 2026-02-17 | 13F | Glenmede Trust Co Na | 10.500 | -38,30 | 169 | -51,16 | ||||
| 2025-09-29 | NP | RSP - Invesco S&P 500 Equal Weight ETF This fund is a listed as child fund of Invesco Ltd. and if that institution has disclosed ownership in this security, then these positions will not be double counted when calculating total shares and total value | 8.069.446 | 15,97 | 136.696 | 10,12 | ||||
| 2026-02-06 | 13F | Handelsbanken Fonder AB | 244.500 | 2,43 | 4 | -25,00 | ||||
| 2026-02-09 | 13F | Shufro Rose & Co Llc | 32.815 | -8,77 | 528 | -27,51 | ||||
| 2026-02-13 | 13F | Mariner, LLC | 20.985 | 22,22 | 337 | 2,74 | ||||
| 2026-02-17 | 13F | SummitTX Capital, L.P. | 1.176.734 | 60,98 | 18.922 | 35,17 | ||||
| 2026-01-21 | 13F | New Wave Wealth Advisors Llc | 14.614 | 23,90 | 235 | 4,00 | ||||
| 2026-01-20 | 13F | American National Bank | 915 | 0,00 | 15 | -17,65 | ||||
| 2026-02-17 | 13F | California State Teachers Retirement System | 828.280 | -1,46 | 13.319 | -17,26 | ||||
| 2026-03-23 | 13F/A | Barclays Plc | Put | 0 | -100,00 | 0 | ||||
| 2026-02-12 | 13F | Steward Partners Investment Advisory, Llc | 10.945 | 3,58 | 176 | -12,87 | ||||
| 2025-12-18 | 13F | Danica Pension, Livsforsikringsaktieselskab | 0 | -100,00 | 0 | |||||
| 2025-11-17 | 13F | LGT Financial Advisors LLC | 0 | -100,00 | 0 | |||||
| 2026-02-05 | 13F | Center for Financial Planning, Inc. | 363 | 0,00 | 6 | -16,67 | ||||
| 2025-11-25 | 13F | Briaud Financial Planning, Inc | 0 | -100,00 | 0 | |||||
| 2026-02-13 | 13F | Healthcare Of Ontario Pension Plan Trust Fund | 788.736 | -0,00 | 12.683 | -16,04 | ||||
| 2026-02-03 | 13F | Generali Asset Management SPA SGR | 148.916 | 6,27 | 2.395 | -10,77 | ||||
| 2026-02-12 | 13F | MetLife Investment Management, LLC | 185.897 | -3,10 | 2.989 | -18,62 | ||||
| 2026-01-21 | 13F | Kraematon Investment Advisors, Inc | 0 | -100,00 | 0 | |||||
| 2026-02-04 | 13F | Sentry Investment Management Llc | 1.927 | 0,00 | 0 | |||||
| 2026-02-11 | 13F | Ameritas Investment Partners, Inc. | 38.837 | 624 | ||||||
| 2026-02-10 | 13F | MJT & Associates Financial Advisory Group, Inc. | 0 | -100,00 | 0 | |||||
| 2026-02-02 | 13F | Truist Financial Corp | 317.351 | -27,51 | 5.103 | -39,13 | ||||
| 2026-02-05 | 13F | Applied Finance Capital Management, LLC | 0 | -100,00 | 0 | |||||
| 2025-10-14 | 13F | S.A. Mason LLC | 0 | -100,00 | 0 | |||||
| 2026-02-04 | 13F | Hartford Investment Management Co | 40.371 | 0,00 | 649 | -16,04 | ||||
| 2026-01-14 | 13F | Cypress Wealth Services, LLC | 16.614 | -26,70 | 267 | -38,48 | ||||
| 2026-02-17 | 13F | FIL Ltd | 158.725 | -6,54 | 2.552 | -21,53 | ||||
| 2026-01-08 | 13F | Sarasin & Partners LLP | 125.342 | -10,02 | 2.015 | -23,90 | ||||
| 2026-02-17 | 13F | Capital Fund Management S.a. | Put | 33.500 | 98,22 | 539 | 66,56 | |||
| 2026-01-23 | 13F | TFC Financial Management | 0 | -100,00 | 0 | |||||
| 2026-01-29 | 13F | Quadcap Wealth Management, LLC | 32.564 | -10,94 | 524 | -25,29 | ||||
| 2026-02-13 | 13F | Oarsman Capital, Inc. | 10.650 | 171 | ||||||
| 2026-02-13 | 13F | Motiv8 Investments LLC | 1.502 | 0 | ||||||
| 2026-02-17 | 13F | Capital Fund Management S.a. | Call | 69.200 | 53,44 | 1.113 | 28,85 | |||
| 2026-02-12 | 13F | APG Asset Management N.V. | 347.656 | -12,93 | 4.760 | -26,86 | ||||
| 2026-01-22 | 13F | Financial Consulate, Inc | 30 | 50,00 | 0 | |||||
| 2026-02-10 | 13F | DT Investment Partners, LLC | 284 | 0,00 | 5 | -20,00 | ||||
| 2026-01-21 | 13F | Y.D. More Investments Ltd | 8.165 | -25,24 | 131 | -37,32 | ||||
| 2026-02-13 | 13F | Rafferty Asset Management, LLC | 89.852 | -3,86 | 1.445 | -19,28 | ||||
| 2026-02-11 | 13F | Jpmorgan Chase & Co | 30.674.812 | 8,64 | 493.251 | -8,78 | ||||
| 2026-02-17 | 13F | Jain Global LLC | 28.324 | 455 | ||||||
| 2026-01-29 | 13F | Nbc Securities, Inc. | 19.669 | 87,16 | 316 | 57,21 | ||||
| 2026-02-18 | 13F | NFP Retirement, Inc. | 11.746 | -1,56 | 189 | -17,54 | ||||
| 2026-02-11 | 13F | CSM Advisors, LLC | 14.125 | 0,00 | 0 | |||||
| 2025-11-14 | 13F | AXA Investment Managers S.A. | 938.278 | 17.968 | ||||||
| 2025-11-14 | 13F | Axa S.a. | 0 | -100,00 | 0 | |||||
| 2026-02-12 | 13F | Cibc World Markets Corp | 271.430 | 4.365 | ||||||
| 2026-02-13 | 13F | State Street Corp | 49.373.466 | -0,25 | 793.925 | -16,24 | ||||
| 2026-02-09 | 13F | Arista Wealth Management, LLC | 0 | -100,00 | 0 | |||||
| 2026-01-29 | 13F | Marathon Capital Management | 247.542 | -4,82 | 3.980 | -20,08 | ||||
| 2025-11-14 | 13F | Resolution Capital Ltd | 0 | -100,00 | 0 | -100,00 | ||||
| 2026-02-12 | 13F | Xponance, Inc. | 218.446 | 51,45 | 3.513 | 27,15 | ||||
| 2026-02-02 | 13F | Strs Ohio | 1.816.278 | -16,17 | 29.206 | -29,61 | ||||
| 2026-02-17 | 13F | Wealthedge Investment Advisors, Llc | 150.539 | 6,51 | 2.421 | -10,57 | ||||
| 2026-02-17 | 13F | Cetera Investment Advisers | 435.120 | 7,32 | 6.997 | -9,88 | ||||
| 2026-02-17 | 13F | Cape Investment Advisory, Inc. | 9.240 | 2,45 | 149 | -13,95 | ||||
| 2025-11-13 | 13F | Change Path, LLC | 0 | -100,00 | 0 | -100,00 | ||||
| 2026-02-11 | 13F | Cedar Mountain Advisors, LLC | 466 | 0,00 | 7 | -12,50 | ||||
| 2026-02-17 | 13F | DoubleLine ETF Adviser LP | 44.886 | 3,83 | 722 | -12,82 | ||||
| 2026-02-23 | 13F | Mv Capital Management, Inc. | 1.125 | -17,28 | 18 | -21,74 | ||||
| 2026-02-17 | 13F | Boothbay Fund Management, Llc | 56.328 | 393,89 | 906 | 315,14 | ||||
| 2026-01-14 | 13F | Jfs Wealth Advisors, Llc | 1 | 0,00 | 0 | |||||
| 2026-01-21 | 13F | Naviter Wealth, LLC | 35.479 | -16,64 | 571 | -30,06 | ||||
| 2026-01-23 | 13F | Aspect Partners, LLC | 114 | 17,53 | 2 | 0,00 | ||||
| 2026-02-13 | 13F | Pinnacle Wealth Planning Services, Inc. | 4.389 | 71 | ||||||
| 2026-02-09 | 13F | Annis Gardner Whiting Capital Advisors, LLC | 0 | -100,00 | 0 | |||||
| 2026-02-13 | 13F | Panagora Asset Management Inc | 0 | -100,00 | 0 | |||||
| 2026-01-30 | 13F | Ares Financial Consulting, LLC | 228 | 4 | ||||||
| 2026-02-13 | 13F | Bollard Group LLC | 4.525 | 1,78 | 0 | |||||
| 2026-02-18 | 13F | Achmea Investment Management B.V. | 86.365 | -74,54 | 1 | -83,33 | ||||
| 2026-02-12 | 13F | Principal Securities, Inc. | 56.026 | 3,90 | 901 | -12,79 | ||||
| 2026-02-10 | 13F | Bnp Paribas Arbitrage, Sa | 1.663.762 | 25,13 | 26.753 | 5,07 | ||||
| 2026-02-11 | 13F | Rise Advisors, LLC | 0 | -100,00 | 0 | |||||
| 2026-01-30 | 13F | Us Bancorp \de\ | 44.962 | -5,58 | 723 | -20,75 | ||||
| 2026-01-15 | 13F | Allspring Global Investments Holdings, LLC | 31.877 | 9,25 | 516 | -7,69 | ||||
| 2026-02-02 | 13F | Robertson Stephens Wealth Management, LLC | 21.100 | 0,00 | 339 | -16,09 | ||||
| 2026-01-23 | 13F | Valley National Advisers Inc | 832 | 0,00 | 0 | |||||
| 2026-01-23 | 13F | Assetmark, Inc | 432.796 | 8,37 | 6.959 | -9,00 | ||||
| 2026-02-17 | 13F | Credit Agricole S A | 257.993 | 11,39 | 4.149 | -6,47 | ||||
| 2026-01-27 | 13F | Measured Risk Portfolios, Inc. | 94.090 | -1,15 | 1.513 | -17,01 | ||||
| 2026-01-30 | 13F | State of New Jersey Common Pension Fund D | 407.110 | -0,10 | 6.546 | -16,12 | ||||
| 2026-02-12 | 13F | Advocate Investing Services LLC | 1.600 | 26 | ||||||
| 2026-02-13 | 13F | Police & Firemen's Retirement System of New Jersey | 104.706 | -6,27 | 1.684 | -21,32 | ||||
| 2026-01-23 | 13F | DHJJ Financial Advisors, Ltd. | 17 | 0,00 | 0 | |||||
| 2025-10-07 | 13F | Sonora Investment Management Group, LLC | 20.459 | 53,47 | 392 | 67,81 | ||||
| 2025-11-14 | 13F | Skopos Labs, Inc. | 0 | -100,00 | 0 | |||||
| 2026-01-21 | 13F | SJS Investment Consulting Inc. | 15 | -99,86 | 0 | -100,00 | ||||
| 2026-02-13 | 13F | Cetera Trust Company, N.A | 9.045 | -22,82 | 145 | -35,27 | ||||
| 2026-02-13 | 13F | Chevy Chase Trust Holdings, Inc. | 352.594 | -0,58 | 5.670 | -16,52 | ||||
| 2026-02-06 | 13F | Tortoise Investment Management, LLC | 0 | -100,00 | 0 | |||||
| 2026-02-13 | 13F | Squarepoint Ops LLC | 637.214 | 28,40 | 10.246 | 7,82 | ||||
| 2026-02-09 | 13F | Atlantic Trust, LLC | 379 | -67,72 | 6 | -72,73 | ||||
| 2026-02-06 | 13F | Fortis Group Advisors, LLC | 465 | 0,00 | 7 | -12,50 | ||||
| 2026-02-17 | 13F | Adelante Capital Management LLC | 0 | -100,00 | 0 | |||||
| 2026-02-06 | 13F | Covestor Ltd | 2.332 | -25,21 | 0 | |||||
| 2026-02-17 | 13F | Apollo Management Holdings, L.P. | 538.110 | 8.653 | ||||||
| 2026-03-04 | 13F | SHP Wealth Management | 56 | 1 | ||||||
| 2026-01-12 | 13F | Avanza Fonder AB | 0 | -100,00 | 0 | |||||
| 2026-02-02 | 13F | Fifth Third Bancorp | 49.226 | -5,68 | 792 | -20,82 | ||||
| 2026-02-11 | 13F | Allianz Asset Management GmbH | 1.283.390 | 89,68 | 20.637 | 59,27 | ||||
| 2026-02-13 | 13F | Towarzystwo Funduszy Inwestycyjnych Pzu Sa | 0 | -100,00 | 0 | |||||
| 2026-01-20 | 13F | Steel Peak Wealth Management LLC | 45.535 | 2,28 | 732 | -14,08 | ||||
| 2026-01-07 | 13F | Massmutual Trust Co Fsb/adv | 4.510 | -9,42 | 73 | -24,21 | ||||
| 2026-02-03 | 13F | Coston, McIsaac & Partners | 343 | 1,78 | 0 | |||||
| 2026-02-09 | 13F | Allstate Corp | 100.345 | 134,36 | 1.614 | 96,95 | ||||
| 2026-02-06 | 13F | Associated Banc-corp | 36.436 | -69,40 | 586 | -74,34 | ||||
| 2026-02-11 | 13F | Inceptionr Llc | 26.026 | 418 | ||||||
| 2026-01-28 | 13F | Legacy Capital Group California, Inc. | 34.929 | -0,72 | 562 | -16,64 | ||||
| 2025-09-29 | NP | XCLR - Global X S&P 500 Collar 95-110 ETF This fund is a listed as child fund of Mirae Asset Global Investments Co., Ltd. and if that institution has disclosed ownership in this security, then these positions will not be double counted when calculating total shares and total value | 45 | 9,76 | 1 | |||||
| 2026-02-09 | 13F | MSH Capital Advisors LLC | 24.239 | 0,29 | 390 | -15,80 | ||||
| 2025-09-29 | NP | VEGN - US Vegan Climate ETF | 3.770 | 12,07 | 64 | 5,00 | ||||
| 2026-02-13 | 13F | Cornerstone Financial Management LLC | 87 | 1 | ||||||
| 2026-01-29 | 13F | Munich Reinsurance Co Stock Corp in Munich | 124.622 | 0,00 | 2.016 | -15,51 | ||||
| 2026-02-17 | 13F | Tudor Investment Corp Et Al | Call | 11.500 | -17,27 | 185 | -30,83 | |||
| 2026-02-17 | 13F | Tudor Investment Corp Et Al | 1.988.328 | 290,02 | 31.972 | 227,51 | ||||
| 2026-01-12 | 13F | CVA Family Office, LLC | 3.051 | -26,18 | 49 | -37,97 | ||||
| 2026-02-12 | 13F | Equity Investment Corp | 7.021.844 | 31,72 | 112.911 | 10,60 | ||||
| 2026-02-13 | 13F | Arrowstreet Capital, Limited Partnership | 0 | -100,00 | 0 | |||||
| 2026-01-26 | 13F | Mirae Asset Global Investments Co., Ltd. | 143.711 | 18,38 | 2.311 | -0,60 | ||||
| 2026-02-10 | 13F | Sfmg, Llc | 0 | -100,00 | 0 | |||||
| 2026-01-16 | 13F | Louisiana State Employees Retirement System | 35.500 | -2,74 | 571 | -18,34 | ||||
| 2026-02-12 | 13F | UniSuper Management Pty Ltd | 261.837 | -19,07 | 4.210 | -32,04 | ||||
| 2025-11-12 | 13F | Dogwood Wealth Management LLC | 0 | -100,00 | 0 | -100,00 | ||||
| 2026-01-22 | 13F | City Holding Co | 0 | -100,00 | 0 | |||||
| 2026-01-20 | 13F | Thurston, Springer, Miller, Herd & Titak, Inc. | 1.290 | 808,45 | 21 | 900,00 | ||||
| 2026-02-03 | 13F | Manske Wealth Management | 17.153 | -6,51 | 276 | -21,65 | ||||
| 2026-01-27 | 13F | GHP Investment Advisors, Inc. | 666 | 0,00 | 11 | -16,67 | ||||
| 2026-02-03 | 13F | Drucker Wealth 3.0, LLC | 0 | -100,00 | 0 | |||||
| 2026-02-12 | 13F | Insigneo Advisory Services, Llc | 25.748 | 13,80 | 414 | -4,39 | ||||
| 2026-02-06 | 13F | Creative Financial Designs Inc /adv | 10.165 | 6,01 | 163 | -10,93 | ||||
| 2026-02-13 | 13F | Morgan Stanley | 12.251.344 | 0,59 | 197.002 | -15,54 | ||||
| 2025-11-10 | 13F | Aew Capital Management L P | 0 | -100,00 | 0 | |||||
| 2026-02-13 | 13F | Transamerica Financial Advisors, Inc. | 6.111 | 98 | ||||||
| 2026-02-13 | 13F | Neo Ivy Capital Management | 0 | -100,00 | 0 | |||||
| 2026-02-17 | 13F | Modern Wealth Management, LLC | 0 | -100,00 | 0 | |||||
| 2025-10-31 | 13F | Sagespring Wealth Partners, Llc | 0 | -100,00 | 0 | |||||
| 2026-02-11 | 13F | Zions Bancorporation, National Association /ut/ | 4.051 | 2,40 | 65 | -13,33 | ||||
| 2026-02-02 | 13F | Varma Mutual Pension Insurance Co | 585.700 | 9.418 | ||||||
| 2026-02-17 | 13F | Northern Trust Corp | 8.380.478 | -17,91 | 134.758 | -31,07 | ||||
| 2026-02-13 | 13F | Ostrum Asset Management | 35.624 | -24,88 | 573 | -37,00 | ||||
| 2026-02-13 | 13F | Schroder Investment Management Group | 2.103.820 | -8,70 | 34.040 | -22,29 | ||||
| 2025-11-13 | 13F | Arkhouse Management Co. LP | 0 | -100,00 | 0 | -100,00 | ||||
| 2026-02-17 | 13F | Royal Bank Of Canada | 1.612.863 | 21,46 | 25.935 | 1,99 | ||||
| 2025-09-29 | NP | CFMCX - Column Mid Cap Fund | 78.146 | 10,49 | 1.402 | 13,81 | ||||
| 2026-02-17 | 13F | Nissay Asset Management Corp /japan/ /adv | 194.809 | 1,47 | 3.133 | -14,80 | ||||
| 2026-02-13 | 13F | Venture Visionary Partners LLC | 0 | -100,00 | 0 | |||||
| 2025-09-29 | NP | SPXL - Direxion Daily S&P 500(R) Bull 3X Shares | 48.198 | 15,39 | 816 | 9,53 | ||||
| 2025-09-29 | NP | SPUU - Direxion Daily S&P 500(R) Bull 2X Shares | 2.175 | 23,86 | 37 | 16,13 | ||||
| 2026-02-10 | 13F | Horizon Bancorp Inc /in/ | 133 | 0,00 | 0 | |||||
| 2026-02-10 | 13F | Catalyst Capital Advisors LLC | 0 | -100,00 | 0 | |||||
| 2026-02-17 | 13F | Polymer Capital Management (US) LLC | 39.795 | 99,04 | 640 | 67,28 | ||||
| 2026-01-15 | 13F | Nisa Investment Advisors, Llc | 97.167 | -46,72 | 1.562 | -55,27 | ||||
| 2026-02-11 | 13F | Parallel Advisors, LLC | 9.161 | -24,31 | 147 | -36,36 | ||||
| 2026-02-13 | 13F/A | Alberta Investment Management Corp | 0 | -100,00 | 0 | -100,00 | ||||
| 2025-11-13 | 13F | Dynamic Technology Lab Private Ltd | 0 | -100,00 | 0 | -100,00 | ||||
| 2026-02-06 | 13F | EverSource Wealth Advisors, LLC | 4.132 | -22,94 | 66 | -35,29 | ||||
| 2026-02-12 | 13F | Hrt Financial Lp | 408.814 | 135,09 | 7 | 100,00 | ||||
| 2026-02-12 | 13F | Nuveen, LLC | 2.048.246 | -27,19 | 32.936 | -38,86 | ||||
| 2026-01-22 | 13F | Bartlett & Co. Wealth Management Llc | 191 | 3 | ||||||
| 2026-02-06 | 13F | Global Retirement Partners, LLC | 68.200 | 51,27 | 1.097 | 27,00 | ||||
| 2026-01-08 | 13F | Grove Bank & Trust | 241 | 0,00 | 4 | -25,00 | ||||
| 2026-01-22 | 13F | Accordant Advisory Group Inc | 0 | -100,00 | 0 | |||||
| 2026-01-27 | 13F | Vert Asset Management LLC | 344.289 | 8,07 | 5.536 | -9,25 | ||||
| 2026-01-29 | 13F | Sanctuary Advisors, LLC | 109.077 | 17,40 | 1.754 | -1,46 | ||||
| 2026-02-13 | 13F | Gen-Wealth Partners Inc | 2.971 | -0,97 | 48 | -17,54 | ||||
| 2026-01-16 | 13F | Trust Co Of Vermont | 4.967 | -3,06 | 80 | -19,39 | ||||
| 2026-02-17 | 13F | Two Sigma Advisers, Lp | 37.252 | 138,00 | 599 | 100,33 | ||||
| 2026-01-12 | 13F | Pensionfund DSM Netherlands | 205.473 | 0,00 | 3 | 0,00 | ||||
| 2026-02-10 | 13F | Kentucky Retirement Systems Insurance Trust Fund | 18.241 | 0,00 | 293 | -16,05 | ||||
| 2026-02-10 | 13F | Natixis Advisors, L.p. | 313.580 | -32,20 | 5 | -37,50 | ||||
| 2026-01-13 | 13F | Mather Group, Llc. | 0 | -100,00 | 0 | |||||
| 2026-01-23 | 13F | Sage Mountain Advisors LLC | 0 | -100,00 | 0 | -100,00 | ||||
| 2026-02-03 | 13F | Farmers & Merchants Investments Inc | 390 | -31,70 | 6 | -40,00 | ||||
| 2026-01-28 | 13F | Aspen Wealth Strategies, LLC | 16.705 | 0,65 | 269 | -15,46 | ||||
| 2026-02-17 | 13F | Hilltop Holdings Inc. | 21.198 | 2,47 | 341 | -14,14 | ||||
| 2025-10-15 | 13F | Stephens Consulting, LLC | 0 | -100,00 | 0 | |||||
| 2026-01-28 | 13F | Oversea-Chinese Banking CORP Ltd | 0 | -100,00 | 0 | -100,00 | ||||
| 2026-02-09 | 13F | Systematic Financial Management Lp | 1.667.139 | 6,68 | 26.808 | -10,42 | ||||
| 2026-02-10 | 13F | Connor, Clark & Lunn Investment Management Ltd. | 882.307 | 14.187 | ||||||
| 2026-02-17 | 13F | MIRAE ASSET GLOBAL ETFS HOLDINGS Ltd. | 124.257 | 3,50 | 2.006 | -12,33 | ||||
| 2025-11-18 | 13F | Cim Investment Mangement Inc | 0 | -100,00 | 0 | -100,00 | ||||
| 2026-02-05 | 13F | North Dakota State Investment Board | 23.852 | 384 | ||||||
| 2026-02-13 | 13F | Caitong International Asset Management Co., Ltd | 0 | -100,00 | 0 | |||||
| 2026-01-22 | 13F | Maseco Llp | 39 | 1 | ||||||
| 2026-01-23 | 13F | Creative Capital Management Investments LLC | 210 | 0,00 | 3 | -25,00 | ||||
| 2026-02-17 | 13F | Ameriprise Financial Inc | 2.238.904 | -15,70 | 35.625 | -28,14 | ||||
| 2026-02-17 | 13F | Quantinno Capital Management LP | 507.158 | -16,73 | 8.155 | -30,08 | ||||
| 2025-11-06 | 13F | Illinois Municipal Retirement Fund | 0 | -100,00 | 0 | |||||
| 2026-02-18 | 13F | EP Wealth Advisors, Inc. | 19.392 | -57,46 | 312 | -61,03 | ||||
| 2026-02-04 | 13F | Securian Asset Management, Inc | 18.897 | -43,69 | 304 | -52,80 | ||||
| 2026-02-12 | 13F | CIBC Private Wealth Group, LLC | 4.360 | -10,12 | 70 | -23,91 | ||||
| 2026-02-17 | 13F | Weiss Asset Management LP | 14.553 | 234 | ||||||
| 2026-01-29 | 13F | Lee Danner & Bass Inc | 20.163 | -40,37 | 324 | -49,92 | ||||
| 2026-02-11 | 13F | First Command Advisory Services, Inc. | 122 | 2 | ||||||
| 2026-01-21 | 13F | Yousif Capital Management, Llc | 101.664 | -3,85 | 1.813 | -10,47 | ||||
| 2026-02-13 | 13F | Kestra Advisory Services, LLC | 0 | -100,00 | 0 | |||||
| 2026-02-05 | 13F | New York Life Investment Management Llc | 156.086 | 65,81 | 2.510 | 39,23 | ||||
| 2026-01-22 | 13F | Comprehensive Money Management Services LLC | 11.511 | -25,26 | 185 | -37,07 | ||||
| 2026-02-11 | 13F | GW&K Investment Management, LLC | 1.563.613 | 25 | ||||||
| 2026-02-09 | 13F | Morningstar Investment Management LLC | 285.545 | 15,17 | 5 | 0,00 | ||||
| 2026-01-13 | 13F | Harrington Investments, INC | 37.381 | -5,61 | 601 | -20,71 | ||||
| 2026-02-12 | 13F | Wedbush Securities Inc | 10.575 | 0 | ||||||
| 2026-02-13 | 13F | 1832 Asset Management L.P. | 1.100.435 | -10,74 | 17.695 | -25,05 | ||||
| 2025-11-07 | 13F | Gsa Capital Partners Llp | 0 | -100,00 | 0 | |||||
| 2025-11-14 | 13F | Mbb Public Markets I Llc | 0 | -100,00 | 0 | -100,00 | ||||
| 2026-02-11 | 13F | Strategic Advocates LLC | 220 | 103,70 | 4 | 50,00 | ||||
| 2025-10-24 | 13F | Meeder Advisory Services, Inc. | 0 | -100,00 | 0 | -100,00 | ||||
| 2026-01-27 | 13F | TD Waterhouse Canada Inc. | 0 | -100,00 | 0 | |||||
| 2026-02-24 | 13F | Chelsea Counsel Co | 150 | 2 | ||||||
| 2026-01-21 | 13F | Flagship Harbor Advisors, Llc | 13.188 | 212 | ||||||
| 2026-02-17 | 13F | XTX Topco Ltd | 110.477 | 1.776 | ||||||
| 2026-02-17 | 13F | Janus Henderson Group Plc | 62.093 | 2,27 | 998 | -14,11 | ||||
| 2026-02-04 | 13F | NAN FUNG TRINITY (HK) Ltd | 165.064 | 2.654 | ||||||
| 2026-02-10 | 13F | Td Asset Management Inc | 273.647 | -19,61 | 4.400 | -32,49 | ||||
| 2026-02-17 | 13F | Balyasny Asset Management Llc | 45.616 | 66,10 | 734 | 39,62 | ||||
| 2026-02-02 | 13F | Sachetta, LLC | 209 | 154,88 | 3 | 200,00 | ||||
| 2026-01-30 | 13F | Trifecta Capital Advisors, LLC | 0 | -100,00 | 0 | |||||
| 2026-02-13 | 13F | Royal London Asset Management Ltd | 7.999 | -74,14 | 129 | -78,38 | ||||
| 2026-01-23 | 13F | Rsm Us Wealth Management Llc | 56.236 | -9,25 | 910 | -23,36 | ||||
| 2026-02-17 | 13F | Public Employees Retirement System Of Ohio | 1.160.446 | -3,23 | 18.660 | -18,74 | ||||
| 2026-02-13 | 13F | Pathstone Holdings, LLC | 63.457 | -35,24 | 1.020 | -45,63 | ||||
| 2026-02-17 | 13F | Private Advisor Group, LLC | 46.874 | 20,13 | 754 | 0,80 | ||||
| 2026-02-17 | 13F | Blair William & Co/il | 13.848 | -4,81 | 223 | -20,14 | ||||
| 2026-02-02 | 13F | Access Investment Management LLC | 17.095 | 0,00 | 327 | 0,00 | ||||
| 2026-02-02 | 13F | Cornerstone Planning Group LLC | 261 | -22,09 | 4 | -20,00 | ||||
| 2026-01-29 | 13F | Teachers Retirement System Of The State Of Kentucky | 54.757 | 0,00 | 1 | -100,00 | ||||
| 2025-11-14 | 13F | Wolverine Trading, Llc | Call | 33.400 | 27,97 | 635 | 39,96 | |||
| 2025-11-14 | 13F | Wolverine Trading, Llc | Put | 63.000 | 260,00 | 1.198 | 295,05 | |||
| 2026-02-13 | 13F | Inspire Advisors, LLC | 53.007 | -5,93 | 852 | -21,04 | ||||
| 2026-01-28 | 13F | Chicago Partners Investment Group LLC | 10.080 | -8,26 | 182 | -8,08 | ||||
| 2026-02-09 | 13F/A | Swedbank AB | 849.215 | 433,38 | 13.655 | 348,00 | ||||
| 2026-02-17 | 13F | State Of Wisconsin Investment Board | 376.605 | -3,24 | 6.056 | -18,76 | ||||
| 2026-02-10 | 13F | Cercano Management LLC | 0 | -100,00 | 0 | |||||
| 2026-01-29 | 13F | Advisors Capital Management, LLC | 1.439.624 | 2,49 | 23.149 | -13,94 | ||||
| 2026-02-17 | 13F | Susquehanna Fundamental Investments, Llc | 0 | -100,00 | 0 | |||||
| 2026-01-08 | 13F | True Wealth Design, LLC | 47 | -40,51 | 1 | -100,00 | ||||
| 2026-02-11 | 13F | Argent Advisors, Inc. | 72.231 | -9,94 | 1.161 | -24,36 | ||||
| 2026-01-14 | 13F | Aegis Wealth Management LLC | 11.967 | -5,76 | 192 | -20,99 | ||||
| 2026-02-09 | 13F | Legal & General Group Plc | 7.051.114 | 8,98 | 113.382 | -8,49 | ||||
| 2026-02-10 | 13F | Intech Investment Management Llc | 23.216 | -4,18 | 373 | -19,61 | ||||
| 2026-02-13 | 13F | National Bank Of Canada /fi/ | 342.865 | -21,21 | 5.516 | -33,84 | ||||
| 2026-02-11 | 13F | Erste Asset Management GmbH | 360.200 | 5.785 | ||||||
| 2026-02-06 | 13F | HighTower Advisors, LLC | 168.945 | -11,08 | 2.717 | -25,34 | ||||
| 2025-11-13 | 13F | Employees Retirement System of Texas | 0 | -100,00 | 0 | |||||
| 2025-10-07 | 13F | Proathlete Wealth Management Llc | 0 | -100,00 | 0 | |||||
| 2025-11-13 | 13F | Texas Capital Bancshares Inc/tx | 50 | 1 | ||||||
| 2026-01-15 | 13F | Fifth Third Wealth Advisors LLC | 22.419 | -2,47 | 360 | -18,18 | ||||
| 2026-02-12 | 13F | Voya Investment Management Llc | 242.199 | -4,03 | 3.895 | -19,41 | ||||
| 2026-01-14 | 13F | Mirador Capital Partners LP | 62.425 | 16,61 | 1.004 | -2,15 | ||||
| 2025-10-30 | 13F | iA Global Asset Management Inc. | 0 | -100,00 | 0 | |||||
| 2026-01-28 | 13F | DekaBank Deutsche Girozentrale | 395.393 | 0,00 | 8 | 14,29 | ||||
| 2025-10-30 | 13F | Twin Peaks Wealth Advisors, LLC | 0 | -100,00 | 0 | |||||
| 2026-01-15 | 13F | Trust Co | 2.142 | 34 | ||||||
| 2026-02-11 | 13F | Deseret Mutual Benefit Administrators | 1.244 | 35,07 | 20 | 17,65 | ||||
| 2026-02-13 | 13F | Arete Wealth Advisors, LLC | 26.507 | -8,74 | 0 | |||||
| 2026-02-05 | 13F | Bessemer Group Inc | 3.512 | -32,59 | 0 | |||||
| 2026-01-23 | 13F | Patton Fund Management, Inc. | 13.002 | 5,25 | 209 | -11,44 | ||||
| 2026-02-17 | 13F | Align Financial, LLC | 691 | 1 | ||||||
| 2026-02-12 | 13F | Swiss National Bank | 1.870.898 | -6,60 | 30.084 | -21,57 | ||||
| 2025-09-29 | NP | CZA - Invesco Zacks Mid-Cap ETF This fund is a listed as child fund of Invesco Ltd. and if that institution has disclosed ownership in this security, then these positions will not be double counted when calculating total shares and total value | 72.113 | -11,08 | 1.222 | -15,56 | ||||
| 2026-02-05 | 13F | Atria Investments Llc | 77.720 | -3,74 | 1.250 | -19,21 | ||||
| 2026-01-28 | 13F | Barrett & Company, Inc. | 137 | -91,08 | 2 | -93,10 | ||||
| 2026-02-11 | 13F | TCTC Holdings, LLC | 1.355 | 0,00 | 22 | -16,00 | ||||
| 2026-02-02 | 13F | Millstone Evans Group, LLC | 170 | 0,00 | 3 | -33,33 | ||||
| 2026-02-17 | 13F | Moore Capital Management, Lp | 157.641 | 2.535 | ||||||
| 2026-01-07 | 13F | Gilbert & Cook, Inc. | 13.329 | 0,37 | 214 | -15,75 | ||||
| 2026-02-13 | 13F | Baird Financial Group, Inc. | 488.094 | 15,93 | 7.849 | -2,65 | ||||
| 2025-11-04 | 13F | Guerra Advisors Inc | 40 | 1 | ||||||
| 2026-01-29 | 13F | Dumont & Blake Investment Advisors Llc | 20.339 | -6,11 | 0 | -100,00 | ||||
| 2026-02-10 | 13F | Commonwealth Of Pennsylvania Public School Empls Retrmt Sys | 388.353 | -1,50 | 6.245 | -17,30 | ||||
| 2026-01-16 | 13F | Ronald Blue Trust, Inc. | 23.105 | 9,43 | 372 | -8,17 | ||||
| 2026-02-05 | 13F | Duncan Williams Asset Management, LLC | 13.808 | -0,70 | 232 | -13,16 | ||||
| 2026-02-17 | 13F | TCG Advisory Services, LLC | 0 | -100,00 | 0 | |||||
| 2026-01-07 | 13F | Mfg Wealth Management, Inc. | 93.119 | 0,58 | 1.497 | -15,52 | ||||
| 2026-02-17 | 13F | Laird Norton Trust Company, Llc | 15.077 | 242 | ||||||
| 2026-02-13 | 13F | Sei Investments Co | 920.354 | 15,49 | 14.799 | -3,02 | ||||
| 2026-01-22 | 13F | Pinnacle Bancorp, Inc. | 200 | 0,00 | 3 | 0,00 | ||||
| 2026-02-11 | 13F | Nemes Rush Group LLC | 8 | 0 | ||||||
| 2026-01-14 | 13F | Wolff Wiese Magana Llc | 139.808 | -12,81 | 2.248 | -26,78 | ||||
| 2026-02-12 | 13F | Jane Street Group, Llc | Call | 23.000 | -39,15 | 370 | -48,96 | |||
| 2026-02-17 | 13F | Utah Retirement Systems | 114.807 | 0,00 | 1.846 | -16,01 | ||||
| 2026-02-12 | 13F | Jane Street Group, Llc | 363.450 | 5.844 | ||||||
| 2026-02-12 | 13F | Jane Street Group, Llc | Put | 33.300 | -43,65 | 535 | -52,70 | |||
| 2026-01-16 | 13F | Standard Life Aberdeen plc | 1.356.606 | 4,22 | 21.814 | -11,96 | ||||
| 2026-02-13 | 13F | Walleye Trading LLC | 0 | -100,00 | 0 | |||||
| 2026-01-22 | 13F | LDR Capital Management LLC | 0 | -100,00 | 0 | |||||
| 2025-11-14 | 13F | Centiva Capital, LP | 0 | -100,00 | 0 | -100,00 | ||||
| 2026-02-04 | 13F | Boston Private Wealth Llc | 14.550 | -3,60 | 234 | -19,38 | ||||
| 2026-02-12 | 13F | Bank Of Montreal /can/ | 541.382 | -7,11 | 8.705 | -22,01 | ||||
| 2026-02-13 | 13F | Mml Investors Services, Llc | 325.667 | 6,32 | 5.237 | -10,72 | ||||
| 2026-02-11 | 13F | Total Wealth Planning & Management, Inc. | 0 | -100,00 | 0 | |||||
| 2026-02-12 | 13F | Triumph Capital Management | 600 | -25,00 | 10 | -40,00 | ||||
| 2026-02-13 | 13F | Walleye Trading LLC | Put | 0 | -100,00 | 0 | ||||
| 2026-02-13 | 13F | Walleye Trading LLC | Call | 0 | -100,00 | 0 | ||||
| 2026-02-10 | 13F | Goldman Sachs Group Inc | 5.091.363 | 22,41 | 81.869 | 2,78 | ||||
| 2026-01-23 | 13F | Farther Finance Advisors, LLC | 79.334 | 74,80 | 1.276 | 46,72 | ||||
| 2026-01-26 | 13F | Private Trust Co Na | 4.293 | -5,27 | 69 | -19,77 | ||||
| 2026-01-21 | 13F | Kentucky Trust Co | 35.849 | -10,18 | 576 | -24,61 | ||||
| 2026-02-10 | 13F | Marshall & Sterling Wealth Advisors Inc. | 0 | -100,00 | 0 | |||||
| 2026-02-17 | 13F | Rakuten Investment Management, Inc. | 91.419 | 13.544,63 | 1.468 | 8.535,29 | ||||
| 2025-11-10 | 13F | Adviser Investments LLC | 0 | -100,00 | 0 | |||||
| 2026-02-12 | 13F | Mark Sheptoff Financial Planning, Llc | 300 | 0,00 | 5 | -20,00 | ||||
| 2026-02-13 | 13F | Stifel Financial Corp | 309.522 | -8,73 | 4.977 | -23,36 | ||||
| 2026-02-10 | 13F | Waterloo Capital, L.P. | 22.328 | -12,26 | 359 | -26,28 | ||||
| 2025-11-21 | 13F/A | CIBC Bancorp USA Inc. | 278.511 | 5.333 | ||||||
| 2026-02-12 | 13F | Wealthspire Advisors, LLC | 0 | -100,00 | 0 | |||||
| 2026-02-13 | 13F | Quarry LP | 12.680 | 204 | ||||||
| 2026-02-17 | 13F | Prelude Capital Management, Llc | 46.560 | 749 | ||||||
| 2026-02-12 | 13F | IFM Investors Pty Ltd | 254.953 | -0,17 | 4 | -99,92 | ||||
| 2026-02-17 | 13F | Banco Bilbao Vizcaya Argentaria, S.a. | 0 | -100,00 | 0 | |||||
| 2026-02-11 | 13F | J.Safra Asset Management Corp | 120 | 0,00 | 2 | -50,00 | ||||
| 2026-02-11 | 13F | Winton Capital Group Ltd | 133.210 | 568,26 | 2.142 | 462,20 | ||||
| 2026-01-26 | 13F | Merit Financial Group, LLC | 67.374 | -4,40 | 1.083 | -19,72 | ||||
| 2026-02-17 | 13F | Black Maple Capital Management LP | 25.000 | 402 | ||||||
| 2026-02-12 | 13F | Quadrant Capital Group Llc | 34.632 | -8,02 | 557 | -22,78 | ||||
| 2026-02-09 | 13F | Hantz Financial Services, Inc. | 77.580 | -12,83 | 1 | 0,00 | ||||
| 2026-02-17 | 13F | Tudor Investment Corp Et Al | Put | 0 | -100,00 | 0 | -100,00 | |||
| 2026-02-17 | 13F | SageView Advisory Group, LLC | 3.282 | 53 | ||||||
| 2026-01-08 | 13F | Wealth Enhancement Advisory Services, Llc | 322.312 | -37,36 | 5.318 | -45,99 | ||||
| 2026-01-27 | 13F | Revisor Wealth Management LLC | 18.899 | 304 | ||||||
| 2026-01-29 | 13F | Vanguard Group Inc | 109.044.442 | -0,29 | 1.753.435 | -16,27 | ||||
| 2026-01-22 | 13F | Apollon Wealth Management, LLC | 13.667 | 8,14 | 220 | -9,50 | ||||
| 2026-01-26 | 13F | Consolidated Portfolio Review Corp | 0 | -100,00 | 0 | |||||
| 2026-02-09 | 13F | Geode Capital Management, Llc | 19.534.041 | 0,64 | 312.959 | -15,49 | ||||
| 2026-02-04 | 13F | Ameritas Advisory Services, LLC | 0 | -100,00 | 0 | |||||
| 2026-02-11 | 13F | Symphony Financial, Ltd. Co. | 31.721 | -0,05 | 513 | -15,09 | ||||
| 2026-02-10 | 13F | CIBC Asset Management Inc | 163.200 | 76,51 | 2.624 | 48,25 | ||||
| 2026-02-13 | 13F | American Century Companies Inc | 7.108.595 | 1,62 | 114.306 | -14,67 | ||||
| 2026-02-10 | 13F | CIBC World Markets Inc. | 255.000 | 0,00 | 4.100 | -16,04 | ||||
| 2026-02-17 | 13F | Rexford Capital Inc | 1.600 | 0,00 | 26 | -16,67 | ||||
| 2026-01-27 | 13F | Evergreen Capital Management Llc | 33.815 | 544 | ||||||
| 2026-02-13 | 13F | Financial Network Wealth Advisors LLC | 170 | 0,00 | 3 | -33,33 | ||||
| 2026-01-21 | 13F | Capital Advisors, Ltd. LLC | 0 | -100,00 | 0 | |||||
| 2026-02-05 | 13F | 1620 Investment Advisors, Inc. | 0 | -100,00 | 0 | |||||
| 2026-02-09 | 13F | Hartland & Co., LLC | 1.947 | 166,35 | 31 | 138,46 | ||||
| 2025-11-12 | 13F | Headlands Technologies LLC | 0 | -100,00 | 0 | |||||
| 2025-11-14 | 13F | PineBridge Investments, L.P. | 0 | -100,00 | 0 | |||||
| 2026-01-20 | 13F | Meridian Investment Counsel Inc. | 152.348 | 2,45 | 2.450 | -13,98 | ||||
| 2026-01-22 | 13F | HHM Wealth Advisors, LLC | 200 | -66,72 | 3 | -72,73 | ||||
| 2026-01-08 | 13F | Armstrong Advisory Group, Inc | 810 | 0,00 | 13 | -13,33 | ||||
| 2026-02-02 | 13F | AlphaStar Capital Management, LLC | 13.720 | 221 | ||||||
| 2026-02-10 | 13F | Meramec Financial Planners, LLC | 8.603 | 145 | ||||||
| 2026-02-13 | 13F | First Trust Advisors Lp | 238.111 | -89,12 | 3.829 | -90,86 | ||||
| 2026-02-17 | 13F | Snowden Capital Advisors LLC | 0 | -100,00 | 0 | |||||
| 2026-02-17 | 13F | NorthRock Partners, LLC | 0 | -100,00 | 0 | |||||
| 2026-02-10 | 13F | Lasalle Investment Management Securities Llc | 533.956 | 0,00 | 8.586 | -16,03 | ||||
| 2026-02-10 | 13F | Cbre Clarion Securities Llc | 5.696.889 | -1,82 | 91.606 | -17,56 | ||||
| 2026-02-12 | 13F | Aviva Plc | 615.134 | 2,77 | 9.891 | -13,71 | ||||
| 2025-11-14 | 13F | Mount Yale Investment Advisors, LLC | 0 | -100,00 | 0 | -100,00 | ||||
| 2026-01-30 | 13F/A | M&t Bank Corp | 1.348.641 | 46,19 | 21.687 | 22,76 | ||||
| 2026-02-09 | 13F | Arvest Bank Trust Division | 36.227 | 583 | ||||||
| 2026-01-26 | 13F | KBC Group NV | 103.977 | -0,57 | 2 | -50,00 | ||||
| 2025-11-17 | 13F | Kestra Investment Management, LLC | 0 | -100,00 | 0 | |||||
| 2026-02-13 | 13F | Fairman Group, LLC | 301 | 490,20 | 5 | |||||
| 2026-02-12 | 13F | Callan Family Office, LLC | 10.765 | 173 | ||||||
| 2026-02-12 | 13F | Penserra Capital Management LLC | 80.094 | -3,05 | 1 | 0,00 | ||||
| 2026-02-10 | 13F | Bank of New York Mellon Corp | 9.641.231 | 42,75 | 155.031 | 19,86 | ||||
| 2026-02-10 | 13F | Ritter Daniher Financial Advisory LLC / DE | 4.201 | 1.073,46 | 68 | 1.016,67 | ||||
| 2026-02-17 | 13F | Adams Wealth Management | 11.790 | 2,72 | 190 | -13,70 | ||||
| 2026-01-28 | 13F | Arizona State Retirement System | 190.662 | -6,76 | 3.066 | -21,73 | ||||
| 2026-02-19 | 13F | CI Private Wealth, LLC | 90.463 | 33,27 | 1.130 | -13,09 | ||||
| 2026-02-17 | 13F | Twinbeech Capital Lp | 195.200 | 3.139 | ||||||
| 2026-01-27 | 13F | Lecap Asset Management Ltd | 104.887 | 1.687 | ||||||
| 2026-02-02 | 13F | Davis Selected Advisers | 435.936 | -2,45 | 7.010 | -18,09 | ||||
| 2026-02-05 | 13F | Isthmus Partners, Llc | 18.959 | 2,08 | 305 | -14,37 | ||||
| 2026-02-03 | 13F | Bokf, Na | 84.393 | -40,56 | 1.357 | -50,07 | ||||
| 2026-02-06 | 13F | Harvest Portfolios Group Inc. | 64.328 | -31,44 | 1.034 | -42,43 | ||||
| 2026-01-27 | 13F | Gf Fund Management Co. Ltd. | 11.513 | -0,51 | 185 | -16,29 | ||||
| 2026-02-17 | 13F | Ameriflex Group, Inc. | 5.566 | 89 | ||||||
| 2026-01-22 | 13F | Alpha Omega Wealth Management LLC | 178.859 | -7,08 | 2.876 | -21,98 | ||||
| 2026-02-04 | 13F | LRI Investments, LLC | 9.103 | 26,64 | 146 | 6,57 | ||||
| 2025-09-29 | NP | XRMI - Global X S&P 500 Risk Managed Income ETF This fund is a listed as child fund of Mirae Asset Global Investments Co., Ltd. and if that institution has disclosed ownership in this security, then these positions will not be double counted when calculating total shares and total value | 539 | -27,26 | 9 | -30,77 | ||||
| 2026-01-09 | 13F | Atlas Brown,Inc. | 11.592 | 1,40 | 186 | -14,68 | ||||
| 2026-02-10 | 13F | Cherry Tree Wealth Management, LLC | 67 | 0,00 | 1 | 0,00 | ||||
| 2026-02-17 | 13F | National Asset Management, Inc. | 12.038 | 13,51 | 194 | -4,93 | ||||
| 2026-02-13 | 13F | Resources Investment Advisors, LLC. | 12.717 | -15,96 | 204 | -29,41 | ||||
| 2026-02-13 | 13F | Silvant Capital Management LLC | 4.479 | 0,00 | 72 | -15,29 | ||||
| 2026-02-18 | 13F | GWM Advisors LLC | 10.213 | -15,64 | 164 | -29,00 | ||||
| 2026-02-02 | 13F | Principal Financial Group Inc | 26.681.771 | -1,12 | 429.043 | -16,97 | ||||
| 2026-02-02 | 13F | Nicholas Hoffman & Company, LLC. | 61.086 | 37,98 | 982 | 15,94 | ||||
| 2026-02-12 | 13F | Cornerstone Capital, Inc. | 342.443 | 0,94 | 5.506 | -15,24 | ||||
| 2026-02-13 | 13F | Bank Of Nova Scotia | 108.732 | 31,34 | 1.748 | 10,28 | ||||
| 2026-02-10 | 13F | Rothschild Investment Llc | 1.861 | 6,77 | 30 | -12,12 | ||||
| 2026-01-07 | 13F | Retirement Wealth Solutions LLC | 0 | -100,00 | 0 | |||||
| 2026-01-16 | 13F | Crowley Wealth Management, Inc. | 0 | -100,00 | 0 | |||||
| 2026-02-17 | 13F | Ancora Advisors, LLC | 1.753 | 314,42 | 28 | 250,00 | ||||
| 2026-01-27 | 13F | Asset Management One Co., Ltd. | 1.397.856 | 0,59 | 22.450 | -15,64 | ||||
| 2026-01-29 | 13F | Calamos Advisors LLC | 491.784 | -3,90 | 7.908 | -19,32 | ||||
| 2025-11-06 | 13F | Abich Financial Wealth Management LLC | 12.568 | 241 | ||||||
| 2026-02-10 | 13F | National Pension Service | 57.294 | 87,02 | 921 | 57,17 | ||||
| 2026-02-05 | 13F | Allworth Financial LP | 62.589 | -19,30 | 1.006 | -32,26 | ||||
| 2026-02-17 | 13F | Millennium Management Llc | 3.512.223 | 235,26 | 56.477 | 181,52 | ||||
| 2026-01-26 | 13F | Whittier Trust Co Of Nevada Inc | 10 | 0,00 | 0 | |||||
| 2026-01-20 | 13F | Harbor Capital Advisors, Inc. | 10.056 | 329,56 | 0 | |||||
| 2026-02-13 | 13F | Manufacturers Life Insurance Company, The | 0 | -100,00 | 0 | |||||
| 2026-01-21 | 13F | Signature Resources Capital Management, LLC | 34 | 0,00 | 1 | |||||
| 2026-02-13 | 13F | Umb Bank N A/mo | 7.470 | 62,50 | 120 | 36,36 | ||||
| 2025-10-01 | 13F | Caldwell Trust Co | 0 | -100,00 | 0 | -100,00 | ||||
| 2026-02-17 | 13F | Alliancebernstein L.p. | 979.490 | -9,86 | 15.750 | -24,31 | ||||
| 2026-02-10 | 13F/A | Guinness Atkinson Asset Management Inc | 601 | 10 | ||||||
| 2026-02-03 | 13F | Ballentine Partners, LLC | 12.353 | -6,84 | 199 | -21,74 | ||||
| 2026-02-11 | 13F | SOUTH STATE Corp | 85 | -46,88 | 1 | -66,67 | ||||
| 2026-02-17 | 13F | Fairscale Capital, LLC | 4.608 | 0,00 | 74 | -15,91 | ||||
| 2026-01-27 | 13F | Probity Advisors, Inc. | 20.883 | -10,11 | 336 | -24,55 | ||||
| 2026-02-12 | 13F | Dimensional Fund Advisors Lp | 10.293.147 | 0,63 | 165.516 | -15,50 | ||||
| 2026-02-06 | 13F | Tredje AP-fonden | 112.719 | 0,00 | 1.813 | -16,03 | ||||
| 2026-02-09 | 13F | New Age Alpha Advisors, LLC | 122.312 | -10,85 | 1.967 | -25,16 | ||||
| 2026-02-12 | 13F | BRYN MAWR TRUST Co | 0 | -100,00 | 0 | |||||
| 2026-01-12 | 13F | Salem Investment Counselors Inc | 17.875 | 0,00 | 287 | -16,08 | ||||
| 2026-01-29 | 13F | Concurrent Investment Advisors, LLC | 33.680 | 4,28 | 542 | -12,46 | ||||
| 2025-09-29 | NP | IRET - iREIT(R) - MarketVector Quality REIT Index ETF | 3.215 | -12,04 | 54 | -16,92 | ||||
| 2026-01-08 | 13F | Tompkins Financial Corp | 5.000 | 0,00 | 80 | -15,79 | ||||
| 2026-01-21 | 13F | Vanderbilt University | 17.508 | -73,45 | 282 | -77,73 | ||||
| 2026-01-07 | 13F | Northside Capital Management, LLC | 472.337 | 47,72 | 7.595 | 24,04 | ||||
| 2026-02-03 | 13F | International Assets Investment Management, Llc | 22.622 | 16,05 | 364 | 4,31 | ||||
| 2026-02-13 | 13F | OMERS ADMINISTRATION Corp | 29.469 | -77,65 | 474 | -81,27 | ||||
| 2025-09-29 | NP | CAHEX - Calamos Hedged Equity Income Fund Class A | 38.809 | 0,00 | 657 | -5,06 | ||||
| 2026-01-29 | 13F | Pictet Asset Management Holding SA | 406.460 | -4,03 | 6.536 | -19,41 | ||||
| 2026-01-14 | 13F | Advisors Management Group Inc /adv | 45.370 | -50,46 | 1 | -100,00 | ||||
| 2026-02-18 | 13F | Vident Advisory, LLC | 96.523 | 3,35 | 1.552 | -13,20 | ||||
| 2026-02-09 | 13F | PGGM Investments | 5.703.693 | -22,66 | 92 | -35,46 | ||||
| 2026-02-03 | 13F | Sumitomo Mitsui DS Asset Management Company, Ltd | 246.028 | 5,23 | 3.956 | -11,64 | ||||
| 2026-02-09 | 13F | Mizuho Securities Usa Llc | 50.602 | -0,02 | 924 | 1,65 | ||||
| 2026-02-12 | 13F | New York State Common Retirement Fund | 333.676 | 0,00 | 5.366 | -16,03 | ||||
| 2026-01-15 | 13F | Victory Financial Group, Llc | 14.722 | 31,58 | 237 | 10,28 | ||||
| 2026-02-10 | 13F | Forsta Ap-fonden | 275.200 | -33,93 | 4.425 | -44,51 | ||||
| 2026-02-05 | 13F | Cambridge Investment Research Advisors, Inc. | 436.468 | -8,91 | 7 | -22,22 | ||||
| 2026-01-27 | 13F | WealthCollab, LLC | 0 | -100,00 | 0 | |||||
| 2026-02-12 | 13F | Elo Mutual Pension Insurance Co | 18.746 | -79,13 | 301 | -82,50 | ||||
| 2026-02-03 | 13F | ASR Vermogensbeheer N.V. | 132.913 | -1,12 | 2.137 | -16,98 | ||||
| 2026-01-20 | 13F | Cromwell Holdings LLC | 1.249 | 86,70 | 20 | 66,67 | ||||
| 2026-02-02 | 13F | Oppenheimer Asset Management Inc. | 843.750 | -17,37 | 13.568 | -30,62 | ||||
| 2026-01-28 | 13F | City State Bank | 205 | 0,00 | 3 | 0,00 | ||||
| 2026-02-04 | 13F | Atlantic Union Bankshares Corp | 7.653 | -11,89 | 123 | -25,90 | ||||
| 2026-02-10 | 13F | Gulf International Bank (UK) Ltd | 30.954 | 0,00 | 0 | |||||
| 2025-10-29 | 13F | CFC Planning Co LLC | 0 | -100,00 | 0 | -100,00 | ||||
| 2026-02-04 | 13F | Boyd Watterson Asset Management Llc/oh | 78 | 0,00 | 1 | 0,00 | ||||
| 2026-02-11 | 13F | Manchester Capital Management LLC | 469 | 8 | ||||||
| 2026-02-13 | 13F | Glen Eagle Advisors, LLC | 16 | 0,00 | 0 | |||||
| 2026-01-12 | 13F | DAVENPORT & Co LLC | 623.306 | -9,51 | 10.024 | -24,02 | ||||
| 2026-01-14 | 13F | Accurate Wealth Management, LLC | 11.057 | 1,78 | 185 | -6,60 | ||||
| 2025-11-13 | 13F | South Plains Financial, Inc. | 0 | -100,00 | 0 | |||||
| 2026-02-05 | 13F | Elyxium Wealth, LLC | 1.955 | 31 | ||||||
| 2026-01-29 | 13F | St. Johns Investment Management Company, LLC | 110 | 0,00 | 2 | -50,00 | ||||
| 2026-02-13 | 13F | Brown Advisory Inc | 40.186 | -13,21 | 646 | -27,09 | ||||
| 2026-01-16 | 13F | Perigon Wealth Management, LLC | 11.995 | 16,56 | 193 | -2,54 | ||||
| 2026-02-12 | 13F | Tocqueville Asset Management L.p. | 148.240 | -37,58 | 2.384 | -47,59 | ||||
| 2026-02-09 | 13F | Jefferies Financial Group Inc. | 38.775 | 624 | ||||||
| 2026-02-13 | 13F | Sterling Capital Management LLC | 41.095 | -4,11 | 661 | -19,51 | ||||
| 2026-02-17 | 13F | Jones Financial Companies Lllp | 35.394 | 32,82 | 569 | 12,90 | ||||
| 2026-01-29 | 13F | UBS Group AG | 3.321.710 | -0,82 | 53.413 | -16,72 | ||||
| 2026-02-11 | 13F | Hughes Financial Services, LLC | 1.162 | -7,04 | 19 | -18,18 | ||||
| 2026-01-07 | 13F | Harbor Investment Advisory, Llc | 196 | 37,06 | 3 | 50,00 | ||||
| 2026-02-17 | 13F | Worldquant Millennium Advisors Llc | 771.867 | 272,30 | 12.412 | 212,62 | ||||
| 2025-11-14 | 13F | Texas Permanent School Fund | 0 | -100,00 | 0 | -100,00 | ||||
| 2026-02-05 | 13F | DnB Asset Management AS | 131.063 | -5,96 | 2.107 | -21,03 | ||||
| 2026-02-10 | 13F | Bruce G. Allen Investments, LLC | 6.149 | 38,49 | 99 | 15,29 | ||||
| 2026-02-12 | 13F | Centersquare Investment Management Llc | 5.226.384 | -63,01 | 84.040 | -68,94 | ||||
| 2026-01-23 | 13F | First PREMIER Bank | 400 | 0,00 | 0 | |||||
| 2026-02-17 | 13F | Adage Capital Partners Gp, L.l.c. | 567.443 | -10,31 | 9.124 | -24,69 | ||||
| 2026-02-13 | 13F | Fiduciary Trust Co | 13.758 | -0,35 | 221 | -16,29 | ||||
| 2026-02-27 | 13F | Groupama Asset Managment | 94.536 | -2,12 | 1.520 | -17,79 | ||||
| 2026-02-11 | 13F | Livforsakringsbolaget Skandia, Omsesidigt | 11.912 | 0,00 | 191 | -16,23 | ||||
| 2025-09-29 | NP | INVESCO ACTIVELY MANAGED EXCHANGE-TRADED FUND TRUST - Invesco Real Assets ESG ETF This fund is a listed as child fund of Invesco Ltd. and if that institution has disclosed ownership in this security, then these positions will not be double counted when calculating total shares and total value | 15.733 | 24,87 | 267 | 18,75 | ||||
| 2026-02-03 | 13F | Everence Capital Management Inc | 20.384 | 0,00 | 0 | |||||
| 2026-02-05 | 13F | IMG Wealth Management, Inc. | 119 | 2 | ||||||
| 2025-10-21 | 13F | Econ Financial Services Corp | 0 | -100,00 | 0 | |||||
| 2026-01-23 | 13F | Palouse Capital Management, Inc. | 6.728 | -5,48 | 108 | -20,59 | ||||
| 2026-02-06 | 13F | Cullen/frost Bankers, Inc. | 6.302 | 7,60 | 101 | -9,82 | ||||
| 2026-02-03 | 13F | Garner Asset Management Corp | 225 | 4 | ||||||
| 2025-09-29 | NP | CVSIX - Calamos Market Neutral Income Fund Class A | 511.755 | 0,00 | 8.669 | -5,04 | ||||
| 2026-02-13 | 13F | Saxon Interests, Inc. | 25.983 | 69,71 | 418 | 52,19 | ||||
| 2026-01-30 | 13F | Urban Wealth Management, LLC | 0 | -100,00 | 0 | -100,00 | ||||
| 2026-02-17 | 13F | Redwood Investment Management, Llc | 41.028 | -43,98 | 1 | -100,00 | ||||
| 2025-11-12 | 13F | Advisory Alpha, LLC | 0 | -100,00 | 0 | |||||
| 2026-02-11 | 13F | Meiji Yasuda Life Insurance Co | 0 | -100,00 | 0 | |||||
| 2026-02-13 | 13F | Barclays Plc | 1.610.702 | 7,70 | 25.900 | -9,56 | ||||
| 2026-02-17 | 13F | VestGen Advisors, LLC | 11.824 | -62,07 | 190 | -68,12 | ||||
| 2026-01-30 | 13F | New York State Teachers Retirement System | 572.868 | -1,20 | 9 | -18,18 | ||||
| 2026-01-22 | 13F | Ofi Invest Asset Management | 9.144 | 147 | ||||||
| 2026-01-30 | 13F | Caldwell Securities, Inc | 400 | 0,00 | 6 | -14,29 | ||||
| 2025-11-07 | 13F | Beacon Capital Management, LLC | 0 | -100,00 | 0 | -100,00 | ||||
| 2026-01-28 | 13F | CAPROCK Group, Inc. | 0 | -100,00 | 0 | |||||
| 2026-02-05 | 13F | Sherman Asset Management, Inc. | 4.630 | 0,00 | 74 | -15,91 | ||||
| 2026-02-04 | 13F | Versor Investments LP | 15.000 | 241 | ||||||
| 2026-02-03 | 13F | Ethic Inc. | 52.555 | 63,80 | 845 | 37,62 | ||||
| 2026-01-26 | 13F | Clean Yield Group | 209.858 | -4,63 | 3.375 | -19,91 | ||||
| 2026-01-29 | 13F | Kestra Private Wealth Services, Llc | 10.511 | 0,28 | 169 | -15,50 | ||||
| 2026-01-23 | 13F | Avion Wealth | 61 | -46,49 | 0 | |||||
| 2025-11-14 | 13F | Bramshill Investments, LLC | 0 | -100,00 | 0 | |||||
| 2026-01-28 | 13F | B. Metzler seel. Sohn & Co. AG | 16.508 | 0,00 | 265 | -16,14 | ||||
| 2025-10-21 | 13F | Armor Investment Advisors, LLC | 0 | -100,00 | 0 | -100,00 | ||||
| 2026-02-12 | 13F | Brown Brothers Harriman & Co | 5.404 | 7,24 | 87 | -10,42 | ||||
| 2026-02-19 | 13F | Smith Asset Management Co., LLC | 0 | -100,00 | 0 | |||||
| 2026-02-02 | 13F | Horizon Investments, LLC | 11.372 | 3,28 | 183 | -13,33 | ||||
| 2026-01-12 | 13F | E. Ohman J:or Asset Management AB | 29.545 | 0,00 | 475 | -15,93 | ||||
| 2026-02-17 | 13F | Howard Hughes Medical Institute | 150 | 0,00 | 2 | 0,00 | ||||
| 2026-01-30 | 13F | Wealthfront Advisers Llc | 32.250 | -50,04 | 519 | -58,09 | ||||
| 2026-02-11 | 13F | J.w. Cole Advisors, Inc. | 13.835 | -12,74 | 154 | -49,50 | ||||
| 2026-01-27 | 13F | Journey Advisory Group, LLC | 0 | -100,00 | 0 | |||||
| 2026-02-17 | 13F | CWM Advisors, LLC | 20.382 | 26,02 | 328 | 5,83 | ||||
| 2025-11-14 | 13F | Diligent Investors, LLC | 0 | -100,00 | 0 | -100,00 | ||||
| 2026-02-17 | 13F | Investment Management Corp of Ontario | 271.025 | 5,61 | 4.358 | -11,31 | ||||
| 2026-01-05 | 13F | Rosenberg Matthew Hamilton | 350 | 0,00 | 6 | -16,67 | ||||
| 2026-03-06 | 13F | Hsbc Holdings Plc | 3.262.602 | 7,14 | 52.462 | -9,97 |